
Capture
Examine
Investigate
Available as part of the Radeon™ Developer Tool Suite.
Meet Radeon™ GPU Detective (RGD), a powerful tool for developers to help with post-mortem analysis of GPU crashes.
Supports:
- DirectX® 12
- Vulkan®
Download now - v1.1
Release notes:
- This release adds support for Vulkan® applications.
Benefits
Radeon™ GPU Detective allows you to easily and reliably capture AMD GPU crash dumps from your crashing DirectX® 12 and Vulkan® applications. A concise crash analysis report file will include detailed information that can help to narrow down the cause of the crash.
This command line tool makes the process simple with an intuitive and concise crash analysis summary and useful visualizations.
Gather your evidence
Capture AMD GPU crash dumps and generate crash analysis reports with ease.
RGD ensures you can reproduce the crash with minimum impact on your runtime performance.
Examine your execution
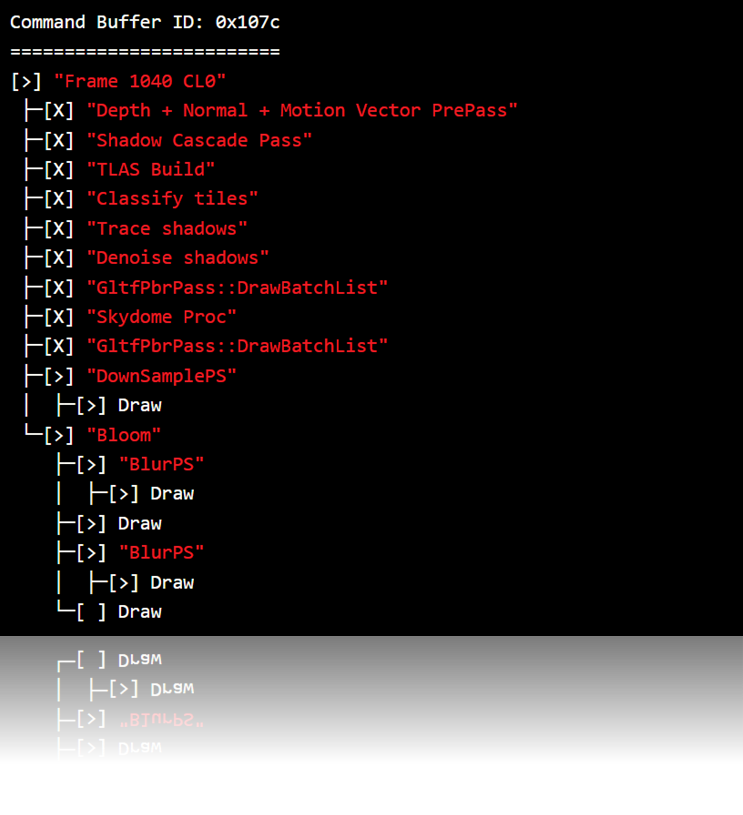
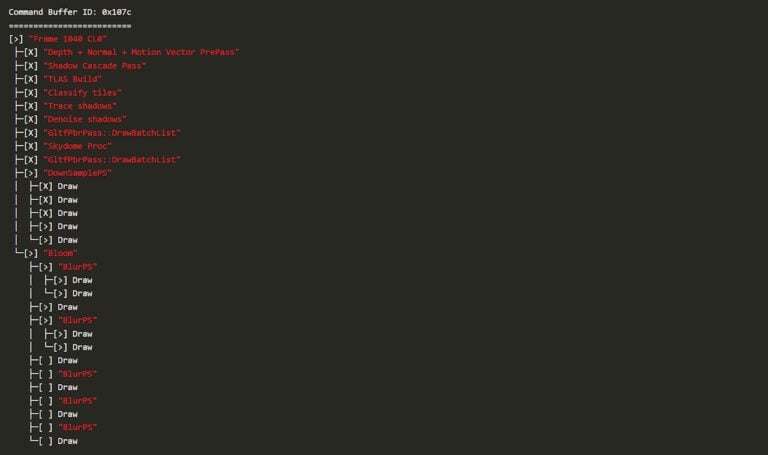
Understand the exact events which led to your crash using the execution marker tree. This tree visualizes the GPU work that was in progress in the moments leading to the crash.
You can insert user markers with custom strings in your code which will be presented in the crash analysis file.
					Command Buffer ID: 0x107c
=========================
[>] "Frame 1040 CL0"
 ├─[X] "Depth + Normal + Motion Vector PrePass"
 ├─[X] "Shadow Cascade Pass"
 ├─[X] "TLAS Build"
 ├─[X] "Classify tiles"
 ├─[X] "Trace shadows"
 ├─[X] "Denoise shadows"
 ├─[X] "GltfPbrPass::DrawBatchList"
 ├─[X] "Skydome Proc"
 ├─[X] "GltfPbrPass::DrawBatchList"
 ├─[>] "DownSamplePS"
 │  ├─[X] Draw
 │  ├─[X] Draw
 │  ├─[X] Draw
 │  ├─[>] Draw
 │  └─[>] Draw
 └─[>] "Bloom"
    ├─[>] "BlurPS"
    │  ├─[>] Draw
    │  └─[>] Draw
    ├─[>] Draw
    ├─[>] "BlurPS"
    │  ├─[>] Draw
    │  └─[>] Draw
    ├─[ ] Draw
    ├─[ ] "BlurPS"
    ├─[ ] Draw
    ├─[ ] "BlurPS"
    ├─[ ] Draw
    ├─[ ] "BlurPS"
    └─[ ] Draw
Probe any page faults
If a page fault is a suspect, check out the page fault summary section to begin your investigation.
This view provides details that can help to shed light on the crash cause, including the offending virtual address, a detailed list of the resources that have ever resided in that virtual address, with information that can help you identify the resources in your code, and a resource timeline that shows the events associated with these resources.
					Timestamp            Event type        Resource type     Resource identifier     Resource size             Resource name
---------            ----------        -------------     -------------------     -------------             -------------
00:00:00.1145408     Create            Buffer            0xd9fb99b500000169      671088640 (640.00 MB)     VidMemBuffer
00:00:00.1154752     Bind              Buffer            0xd9fb99b500000169      671088640 (640.00 MB)     VidMemBuffer
00:00:00.1154752     Make Resident     Buffer            0xd9fb99b500000169      671088640 (640.00 MB)     VidMemBuffer
00:00:01.1202400     Evict             Buffer            0xd9fb99b500000169      671088640 (640.00 MB)     VidMemBuffer
Requirements
Driver
- Latest Adrenalin Software driver (minimum version 23.12.1)
Supported GPUs
- Radeon™ RX 6000 series
- Radeon™ RX 7000 series
Supported graphics APIs
- Direct3D® 12
- Vulkan®
Supported OSs
- Windows® 10
- Windows® 11
Version history
- First public release
Related content
GDC 2024 – Post-mortem GPU crash analysis with AMD Radeon™ GPU Detective (RGD) – YouTube link
This session covers different types of failures – when they occur, why they are difficult to debug, and how RGD can help to identify a crash’s root cause.
GDC 2024: We reveal incredible Work Graphs perf, AMD FSR 3.1, GI with Brixelizer, and so much more
Learn about our GDC 2024 activities, including AMD FSR 3.1, AMD FidelityFX Brixelizer, work graphs, mesh shaders, tools, CPU, and more.

GDC 2024: Work graphs, mesh shaders, FidelityFX™, dev tools, CPU optimization, and more.
Our GDC 2024 presentations this year include work graphs, mesh shaders, AMD FSR 3, GI with AMD FidelityFX Brixelizer, AMD Ryzen optimization, RGD, RDTS, and GPU Reshape!
Radeon™ GPU Detective adds Vulkan® support on Windows®
The latest version of Radeon™ GPU Detective is out now! RGD v1.1 introduces support for post-mortem analysis of Vulkan applications on Windows.
Getting Started with Radeon™ GPU Detective 1.0
Radeon GPU Detective (RGD) is a brand-new tool which is designed to help you capture and investigate GPU crashes. This tutorial covers how to use RGD to capture a crash and how to interpret the results it produces.

Radeon™ GPU Detective (RGD) 1.0 is now available
Radeon™ GPU Detective (RGD) is our brand-new tool for investigating GPU crashes. RGD is included in the Radeon Developer Tool Suite and is available now!

Radeon GPU Analyzer is an offline compiler and performance analysis tool for DirectX®, Vulkan®, SPIR-V™, OpenGL® and OpenCL™.
RGP gives you unprecedented, in-depth access to a GPU. Easily analyze graphics, async compute usage, event timing, pipeline stalls, barriers, bottlenecks, and other performance inefficiencies.
This is a Visual Studio® Code extension for Radeon GPU Analyzer (RGA) to allow you to use RGA directly from within VS Code.
Radeon™ Memory Visualizer (RMV) is a tool to allow you to gain a deep understanding of how your application uses memory for graphics resources.
The RDP provides a communication channel with the Radeon™ Adrenalin driver. It generates event timing data used by the Radeon™ GPU Profiler (RGP), and the memory usage data used by the Radeon™ Memory Visualizer (RMV).
Radeon™ Raytracing Analyzer (RRA) is a tool which allows you to investigate the performance of your raytracing applications and highlight potential bottlenecks.
Our other tools
GPU Reshape is a powerful tool that leverages on-the-fly instrumentation of GPU operations with instruction level validation of potentially undefined behavior.

If you want to know how well a game is performing on your machine in real-time with low overhead, OCAT has you covered.
Compressonator is a set of tools to allow artists and developers to more easily work with compressed assets and easily visualize the quality impact of various compression technologies.


