Visualize.
Analyze.
Optimize.
Available as part of the Radeon™ Developer Tool Suite.
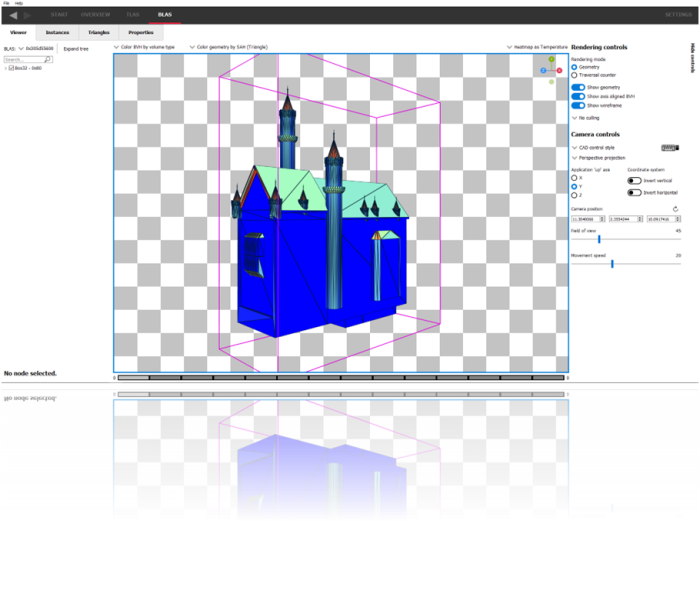
Meet the Radeon™ Raytracing Analyzer (RRA) tool. Investigate the performance of your ray tracing applications and highlight potential bottlenecks.
Download now - v1.5
This release adds the following:
- Ray inspector has been updated to display the ray hierarchy, recursive rays will now display under the parent rays that shot them.
- Improved Device configuration reporting with newer scene files, including CPU and driver information.
- Bug/stability fixes.
Radeon™ Raytracing Analyzer now has ray dispatch features
Radeon Raytracing Analyzer v1.3 adds the ability to inspect casted rays in 3D and examine ray traversal statistics. Check it out now!
Benefits
By using either geometry mode or traversal mode in addition to a selection of coloring modes, RRA allows you to easily spot areas of interest in your scene that need optimizing.
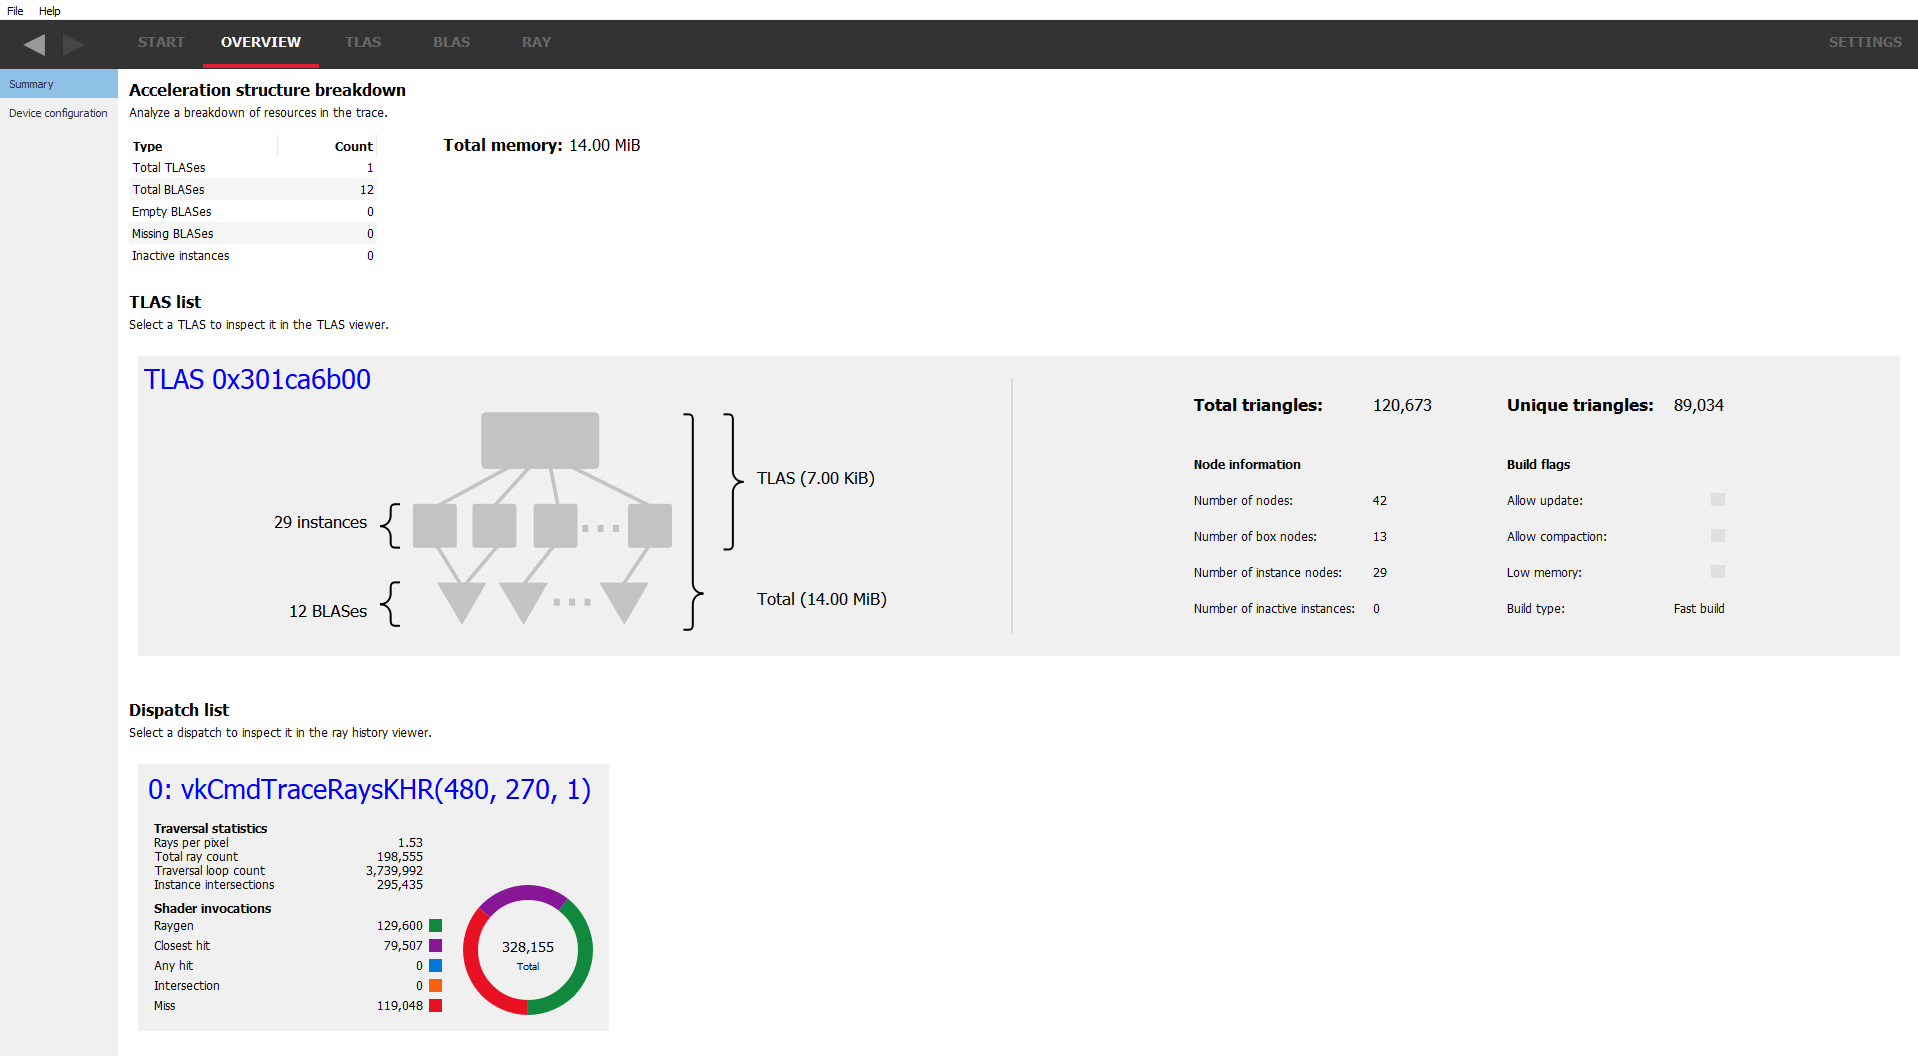
RRA generates easy to understand visualizations of how your DirectX®12 and Vulkan® ray-tracing applications can be optimized. As with all the tools, capturing the ray-tracing content of a game is both quick and simple, using the Radeon™ Developer Panel and our public GPU driver.
To help get you started, we’ve produced a short video and blog post to show you what you need to do:
Introduction to raytracing with Radeon Developer Tool Suite
In this video, Can Alper introduces RRA V1.0. He explains how to capture games using RDP and evaluate when to use RRA.
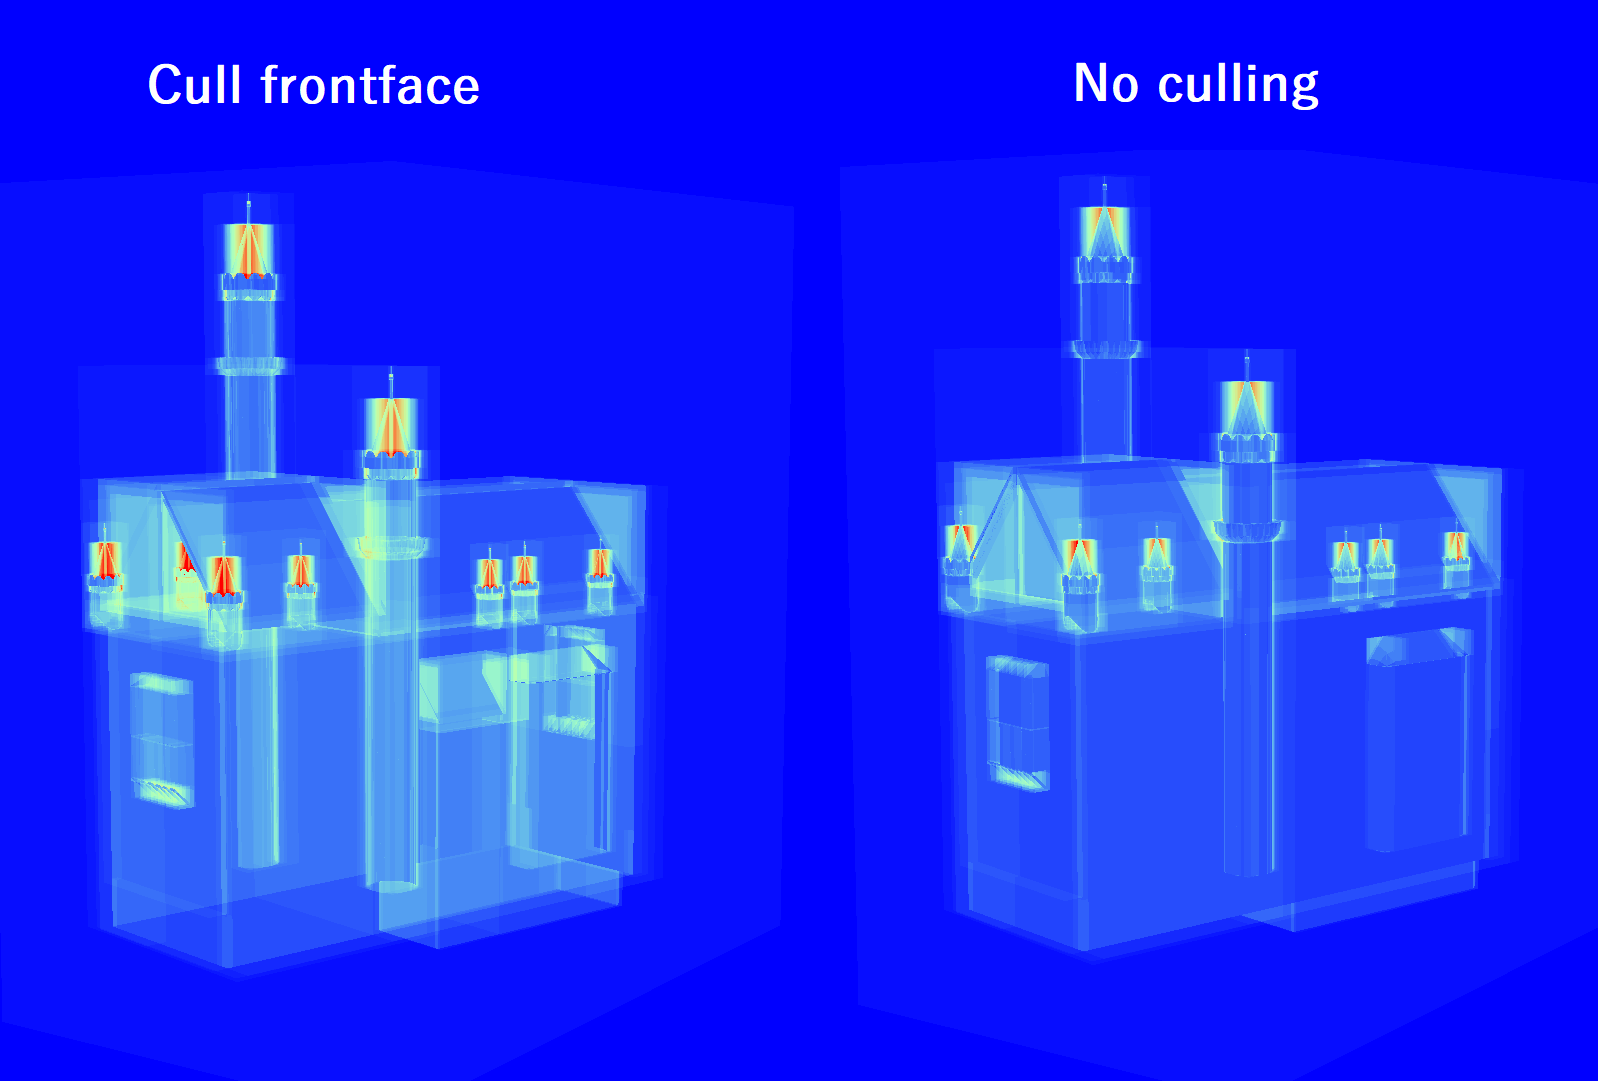
Improving raytracing performance with the Radeon™ Raytracing Analyzer (RRA)
Optimizing the raytracing pipeline can be difficult. Discover how to spot and diagnose common RT pitfalls with RRA, and how to fix them!
Visualize the scene
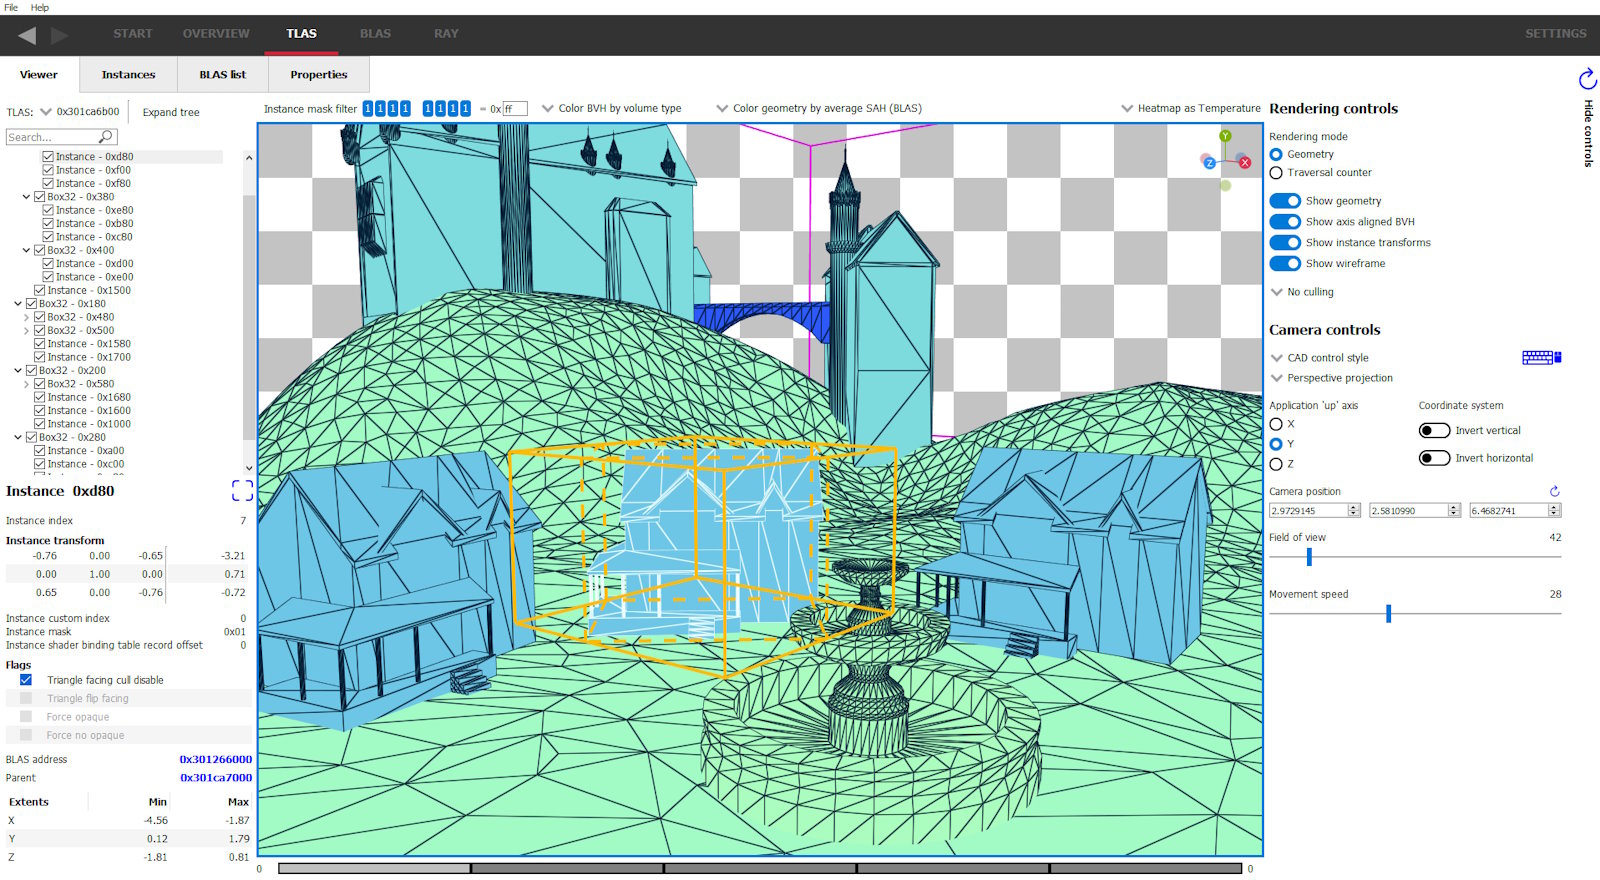
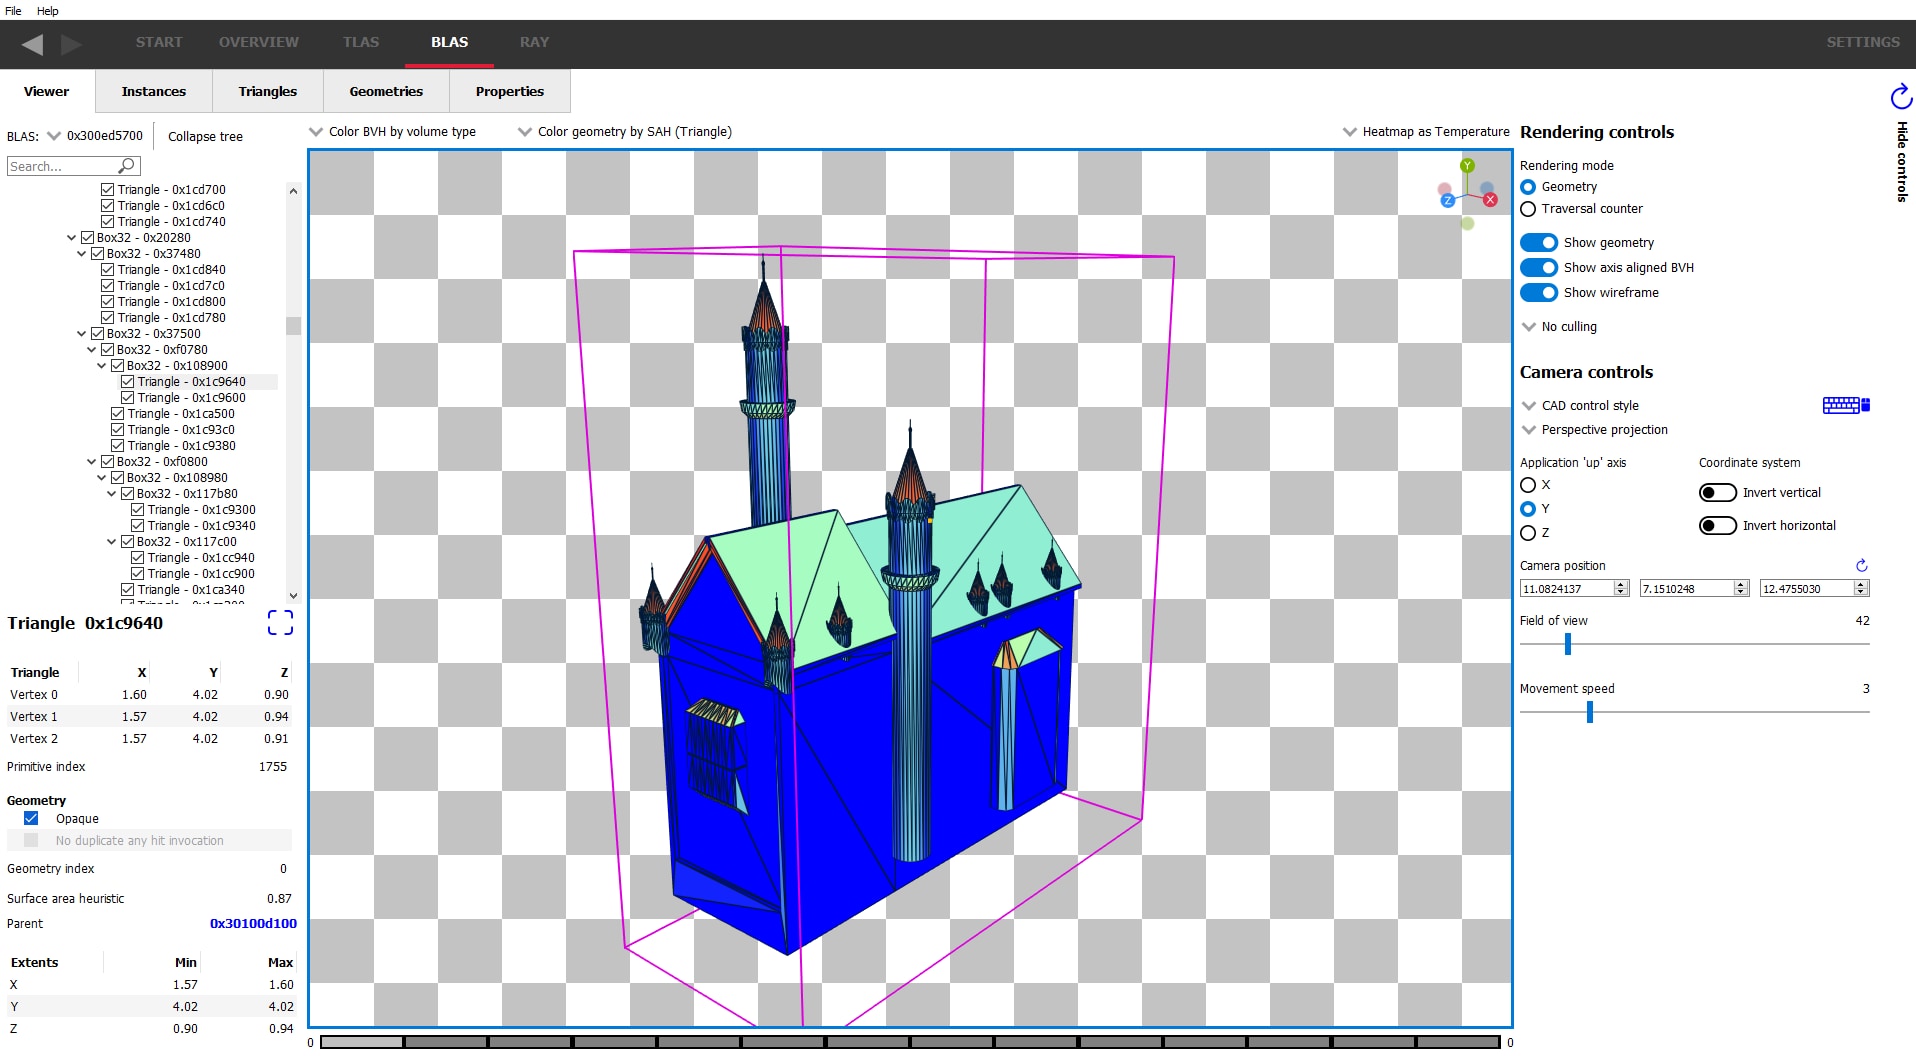
Use the TLAS viewer to visually inspect your scene. Select from a number of coloring modes to highlight areas of interest. See opaque/non-opaque geometry at a glance and a host of other parameters.
Some coloring modes use a range of colors in a heatmap (the surface area heuristic modes, for example) making it easy to see hotspots.
Review your ray traversals
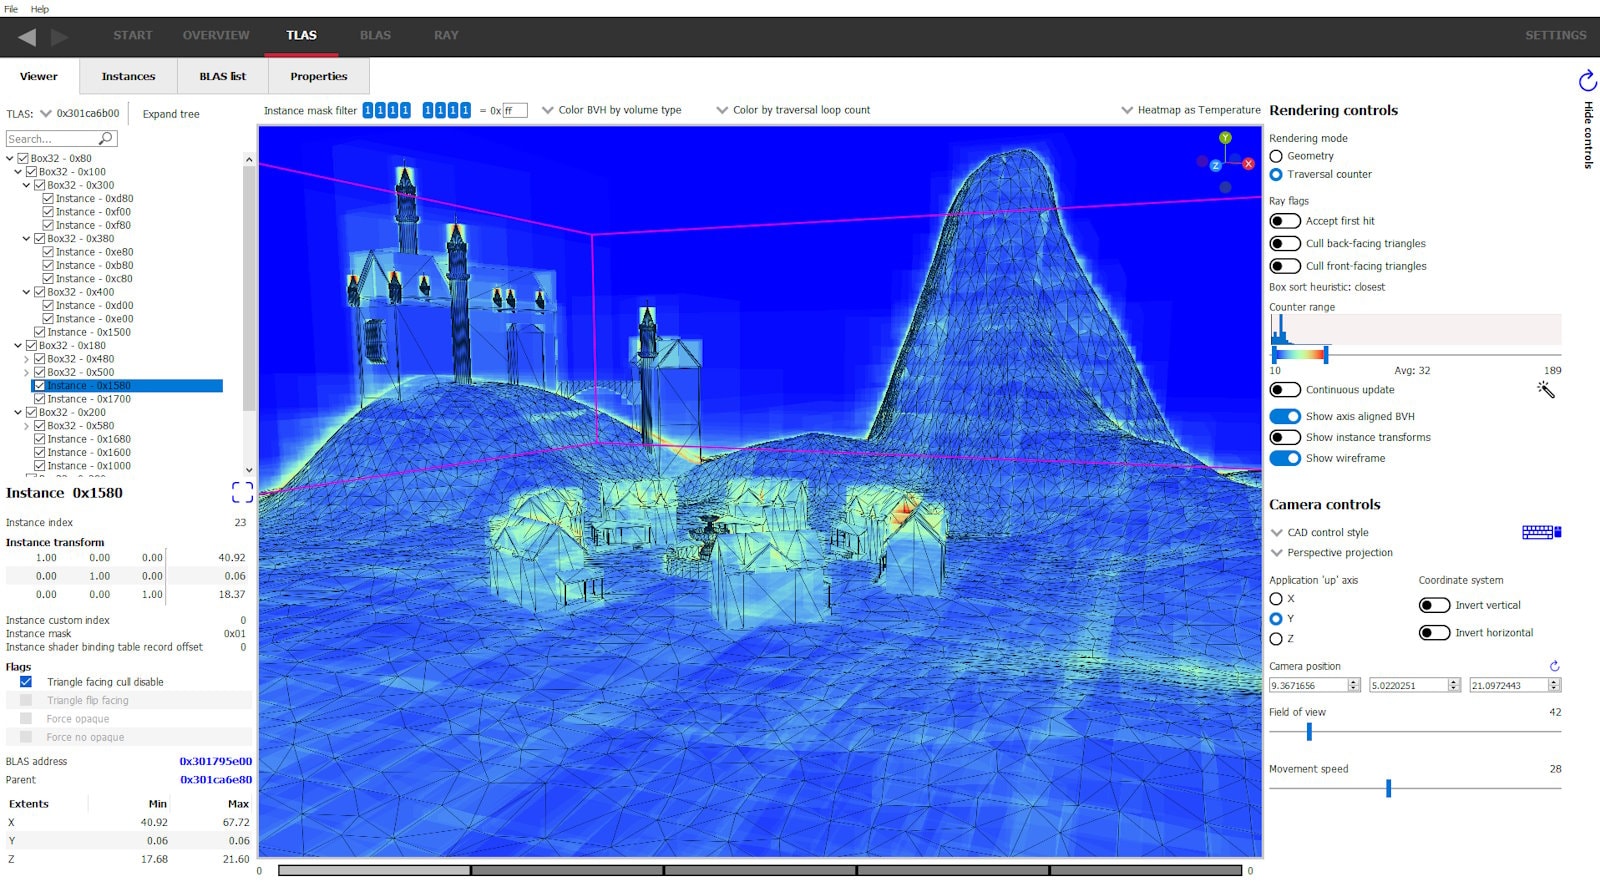
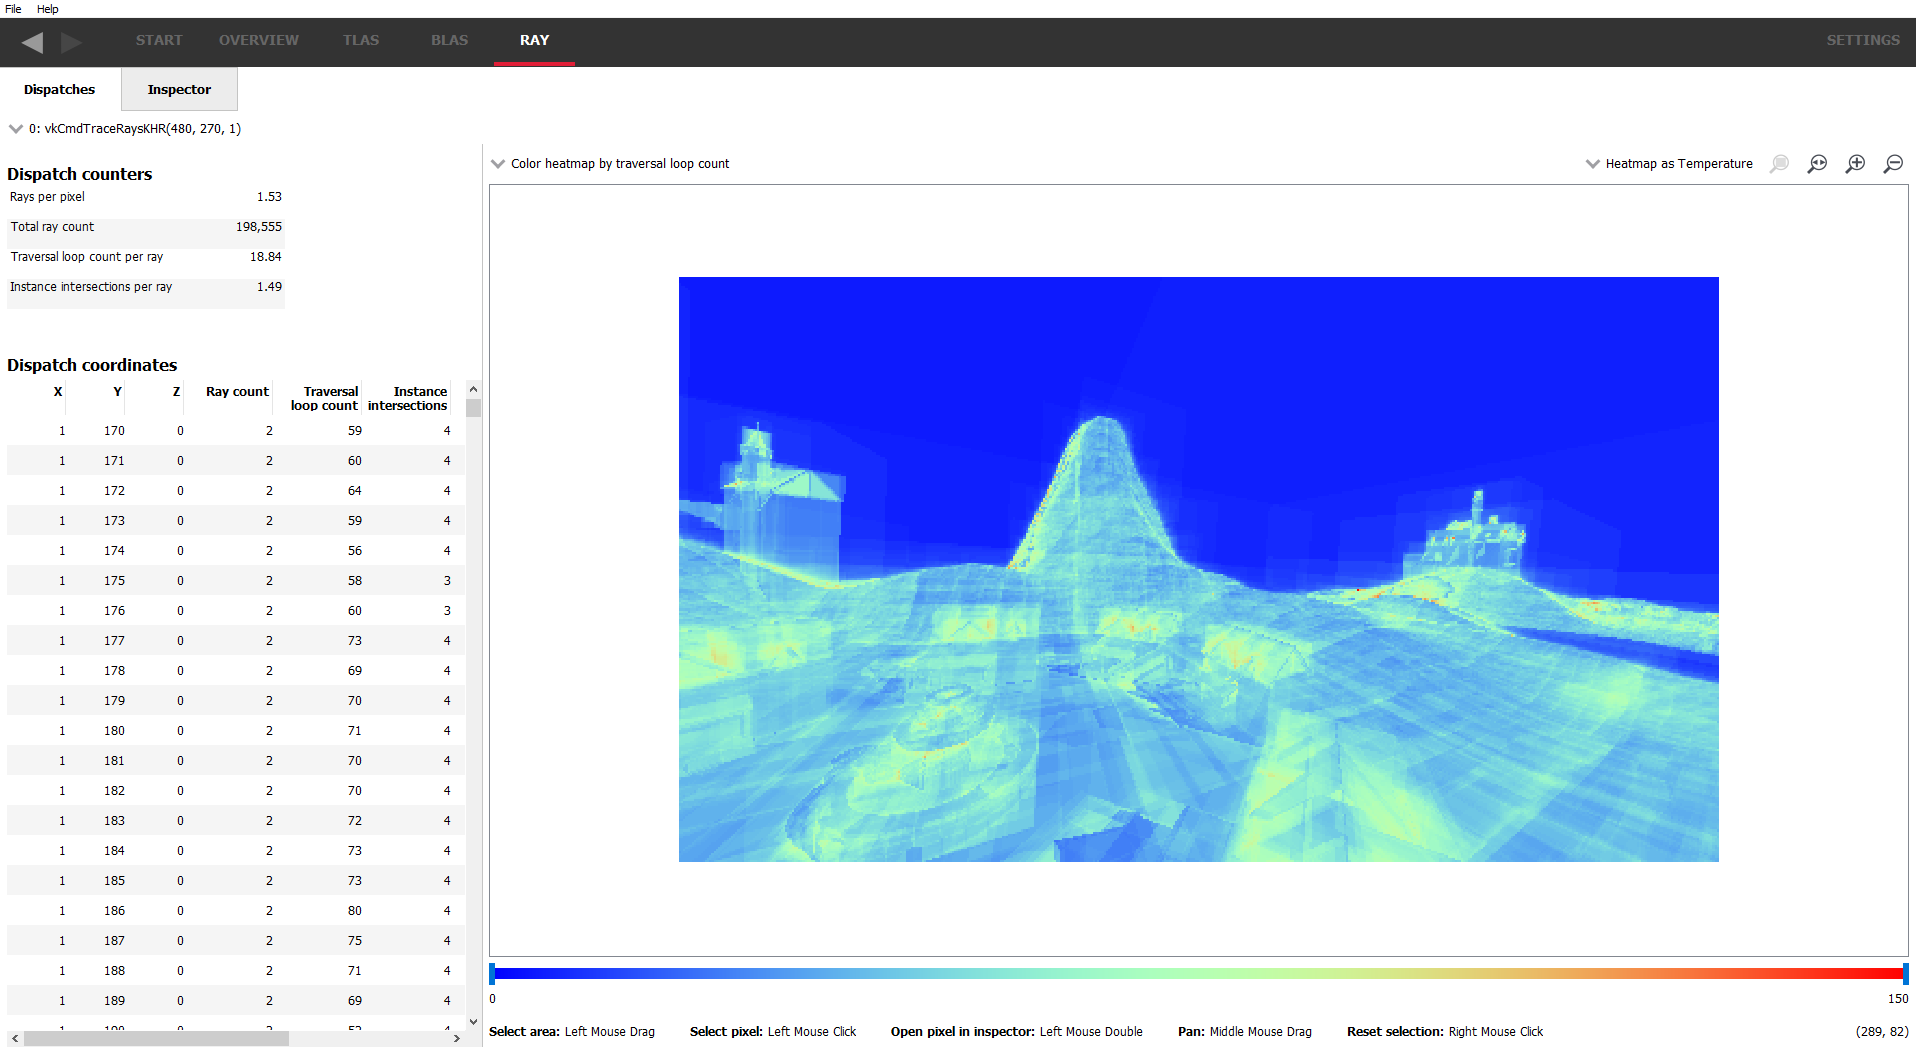
Switch to the traversal counter rendering mode to see how rays interact with your scene.
The heat map image will show areas that require attention. Generally the more red an area, the greater the counter number. The counter types can be selected to show instance hit, box hit/miss, triangle hit/miss and more.
Blast through your BLASes
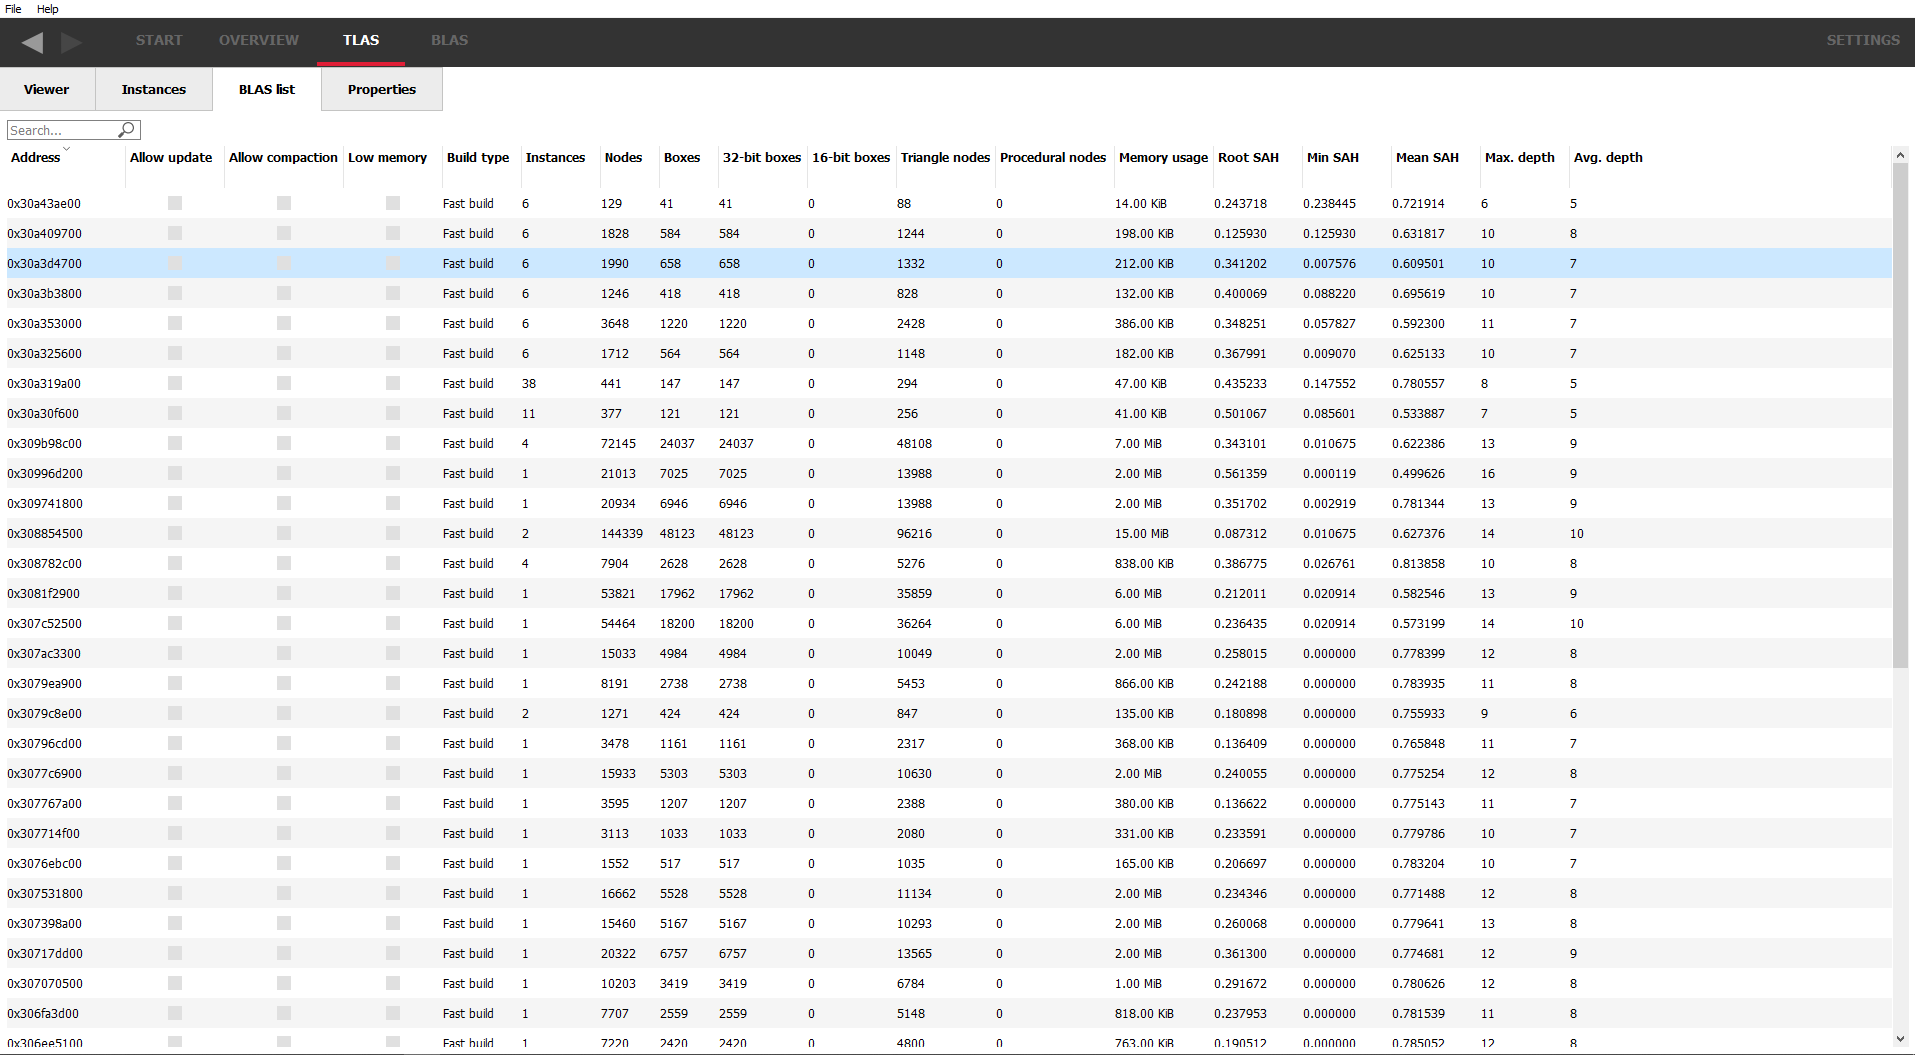
Here, you can see high level statistics for every BLAS in your scene, including things such as memory usage and triangle counts.
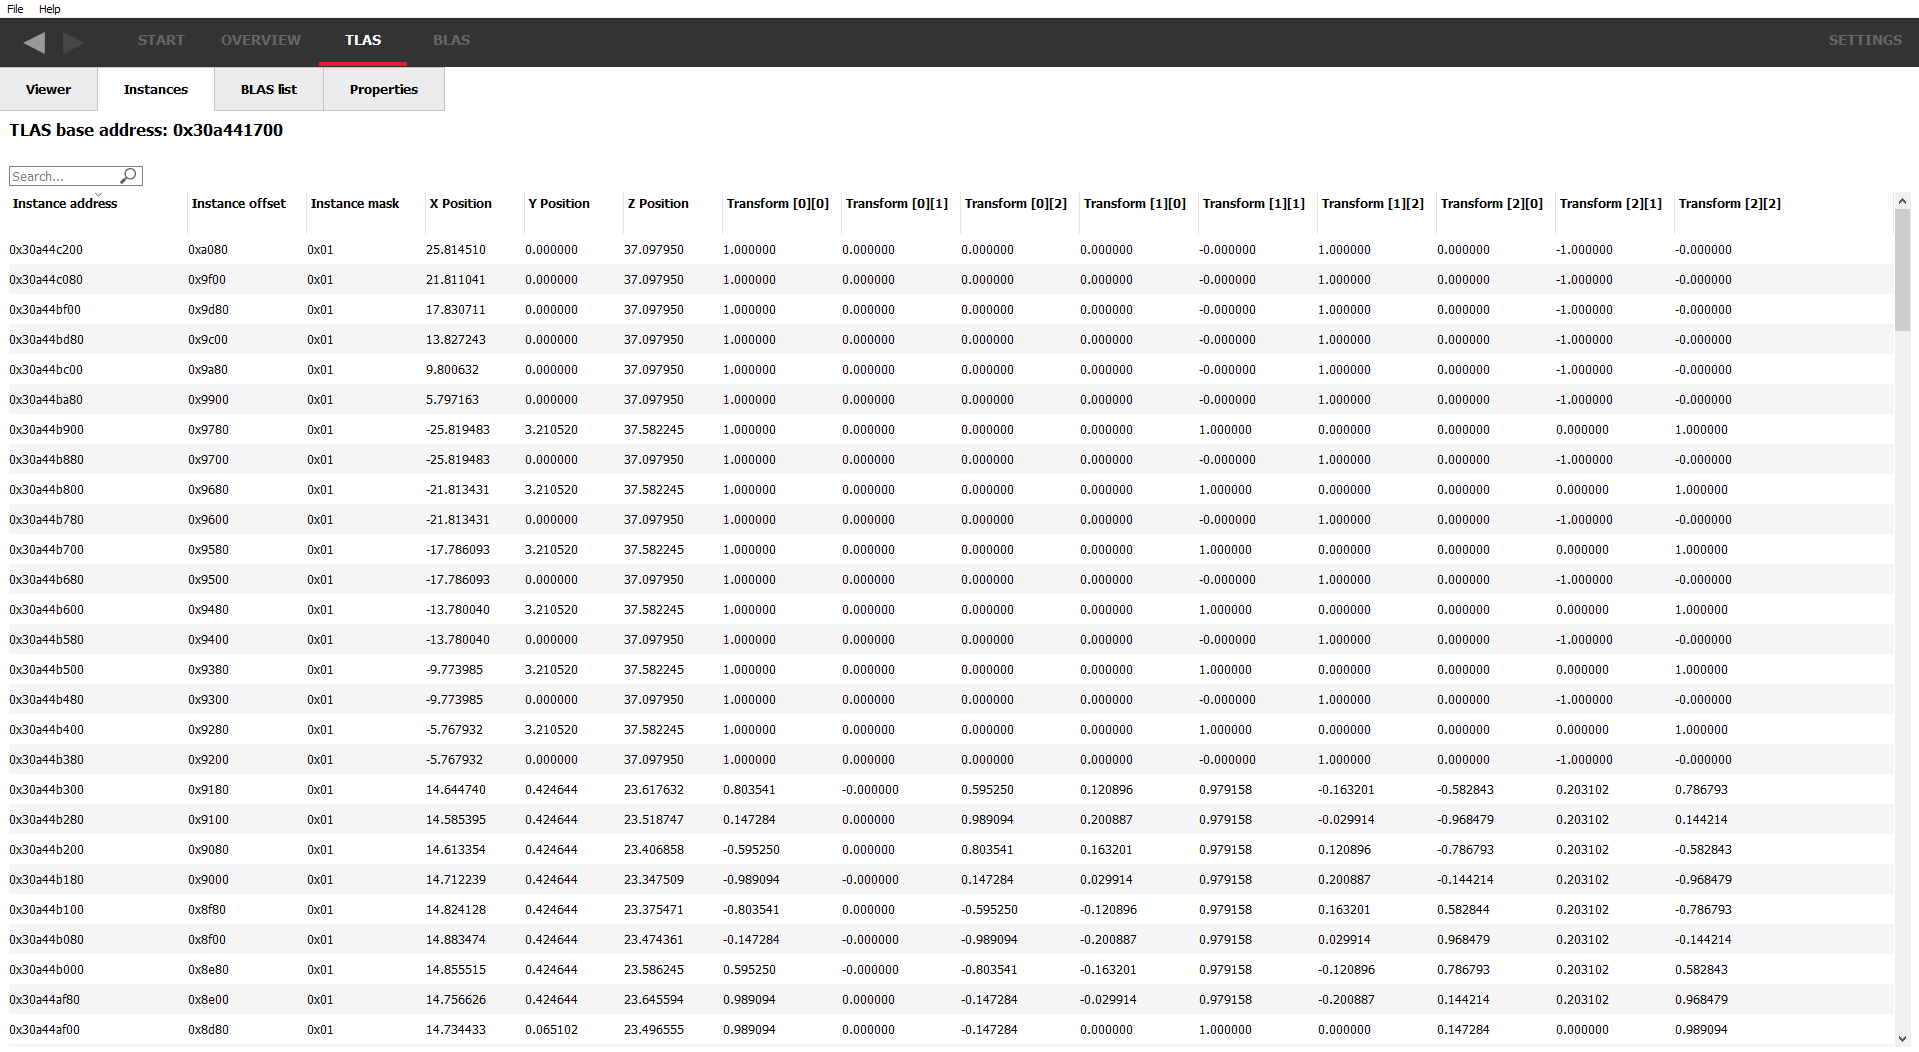
All the tables in RRA, like the other tools, have column sorting and text searching so it’s easy to find what you’re looking for.
Double-clicking on a BLAS will display it in the BLAS viewer, almost identical to the TLAS viewer but allows inspection of a single BLAS.
Reveal your ray dispatches
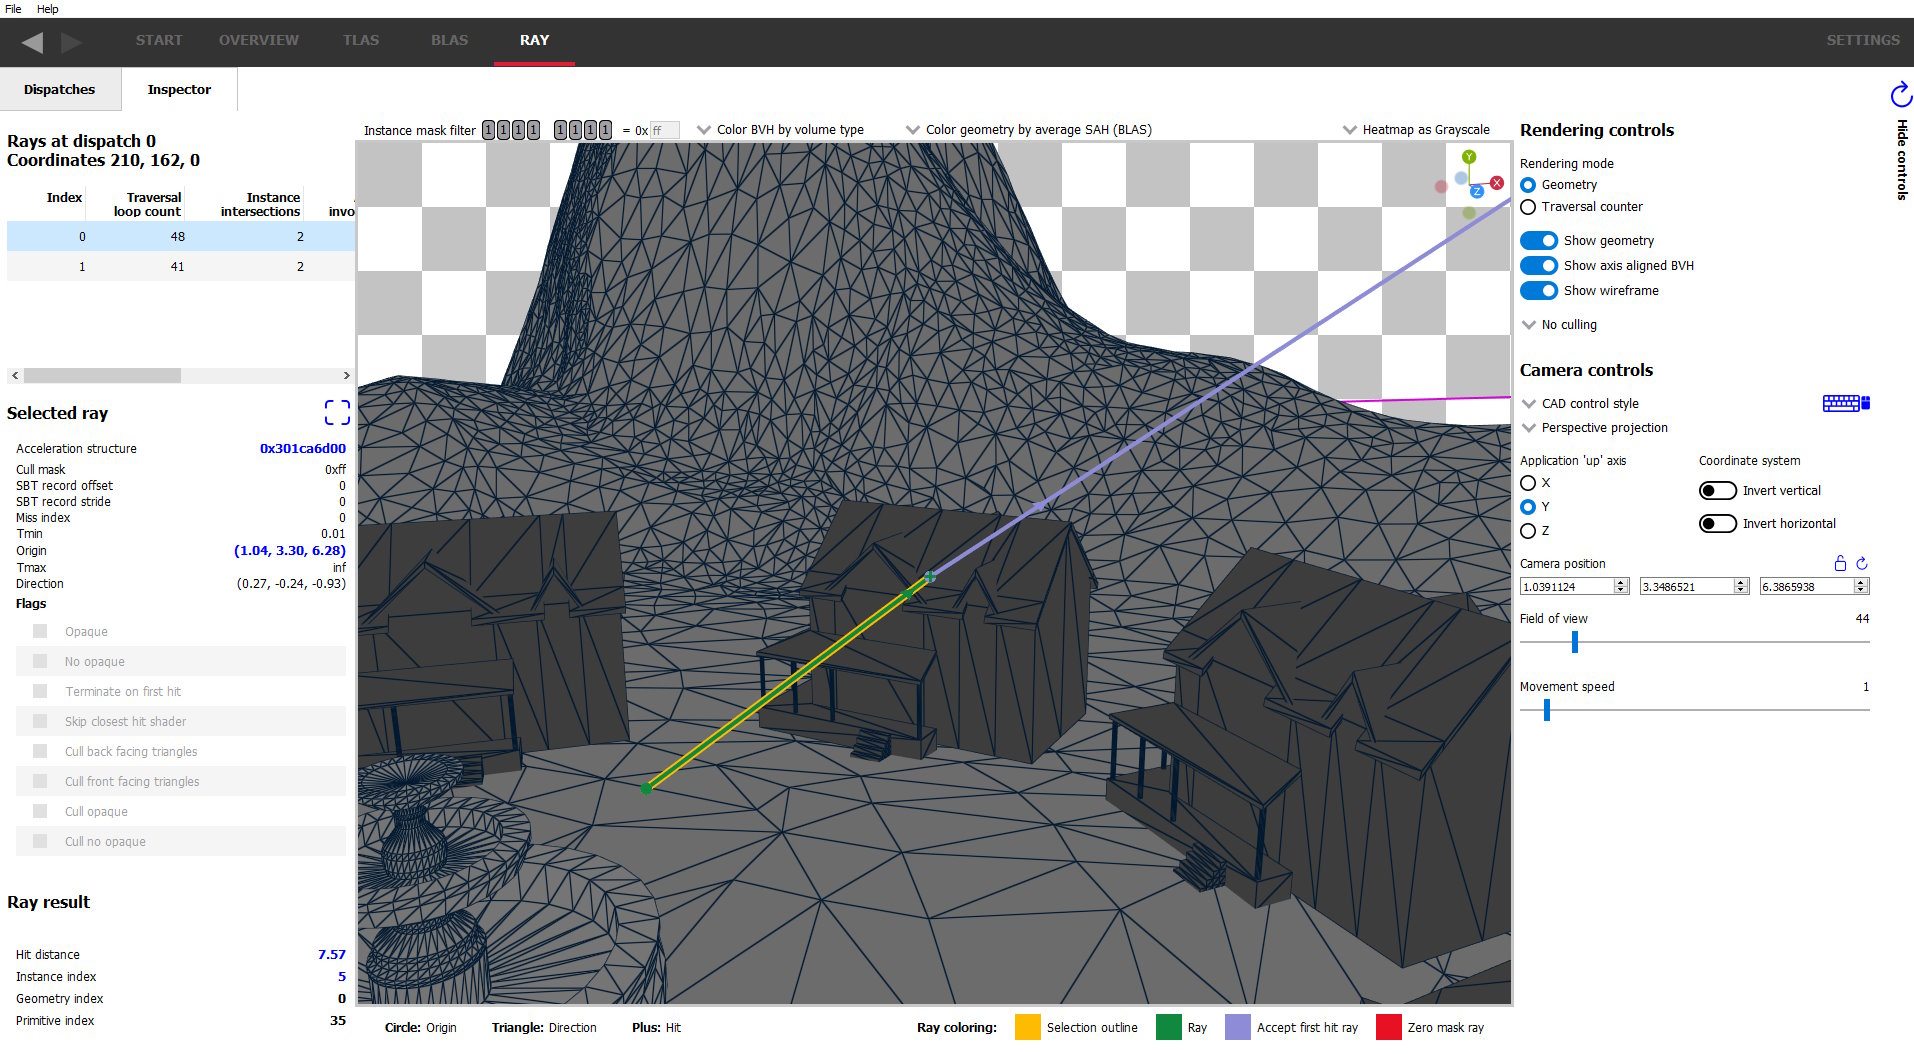
Starting with v1.3, RRA now gives you the ability to see individual rays and how they interact with the scene, showing intersections, misses and the shaders called on those rays, including additional rays generated from the initial ray.
Select a “pixel” from the table or heatmap ..
.. and see the rays that are shot from that pixel.
Requirements
Supported GPUs
- Radeon™ RX 6000 series
- Radeon™ RX 7000 series
Supported graphics APIs
- DirectX® 12
- Vulkan®
Supported OSs
- Windows® 10
- Windows® 11
- Linux – Ubuntu 22.04 LTS (Vulkan® only)
Required driver
Version history
- Ray direction visualization added to dispatch pane.
- Bug/stability fixes.
- Addition of a RAY tab, to enable the ability to visualize dispatches and individual rays.
- Ray Dispatches pane added to visualize ray dispatches and allow selection of pixels within those dispatches.
- Ray Inspector pane added to visualize individual rays and their collisions with scene objects.
- Reset button added to TLAS/BLAS viewer panes and Inspector pane to reset the UI to its default settings.
- Allow viewer UI state to be persistent between RRA sessions via a checkbox in the general settings.
- Bug/stability fixes.
- Ray face culling flags added to traversal viewer pane.
- Geometry list sub-tab added to BLAS tab.
- Addition of an instance mask to the TLAS viewer pane.
- Addition of a histogram to the traversal mode viewer side pane.
- Bug/stability fixes.
- Addition of an axis-free camera.
- Camera placed at 45 degrees above the scene on trace load.
- Support for rebraided instances:
- Coloring mode to show which instances are rebraided.
- Allow selection of rebraided siblings.
- Support for split triangles:
- Improved selection.
- Coloring mode to show which triangles are split.
- Sibling triangles shown and selectable from the UI.
- The ‘Frustum cull ratio’ in the settings has been replaced with “Small object culling”. This should be more intuitive.
- Additional fields added to the instance and triangles tables.
- Keyboard shortcuts added for all panes on the Welcome and Settings lists. Some keys have also been remapped to avoid conflict with the Adrenaline software.
- Bug/stability fixes.
- This is the first public release of the Radeon Raytracing Analyzer
- Visualize bounding volume hierarchies (BVHs).
- Show BVH memory usage, instance and triangle counts, and a whole host of other useful statistics.
- Analyze the application environment, using different rendering and coloring modes.
Related content

Radeon™ Raytracing Analyzer 1.2 adds ray face culling flags, ray traversal histograms, and more
Radeon Raytracing Analyzer v1.2 introduces ray face culling flags, a ray traversal histogram, a geometry list pane, and an instance mask.
Optimizing Game Performance with the Radeon Developer Tool Suite (GDC 2023 – YouTube link)
This talk gives an overview of RGP, RMV, RRA, and RGA, introducing new features and improvements, and reveal the current work in progress.
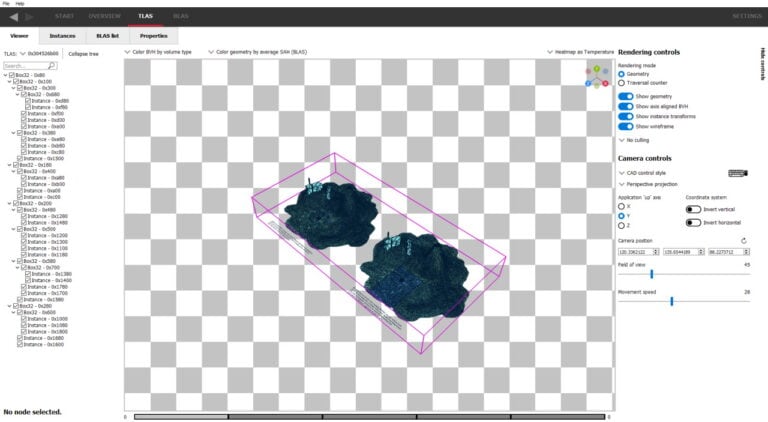
Learn about Radeon™ Raytracing Analyzer 1.1
The latest update for RRA includes changes to the camera system and support for split triangles and rebraided instances. Check it all out here!

GDC 2022 videos
Discover our videos and slides from the GDC 2022, including FSR 2.0, ray tracing, Ryzen optimizations, and presentations with game devs.
Raytracing Performance Revealed – How to Optimize your Game with the Radeon™ Developer Tool Suite – YouTube link
In this presentation, we demonstrate how to use Radeon™ GPU Profiler and Radeon™ Raytracing Analyzer, to illuminate performance issues.
Breaking down the world of Athia: the technologies of Forspoken – YouTube link
This session covers the collaboration between AMD and Luminous Productions on their upcoming title: Forspoken.
Performant Reflective Beauty – Hybrid Raytracing with Far Cry 6 – YouTube link
This session covers the collaboration between AMD and Ubisoft on Far Cry 6, implementing Hybrid RayTraced Reflections.
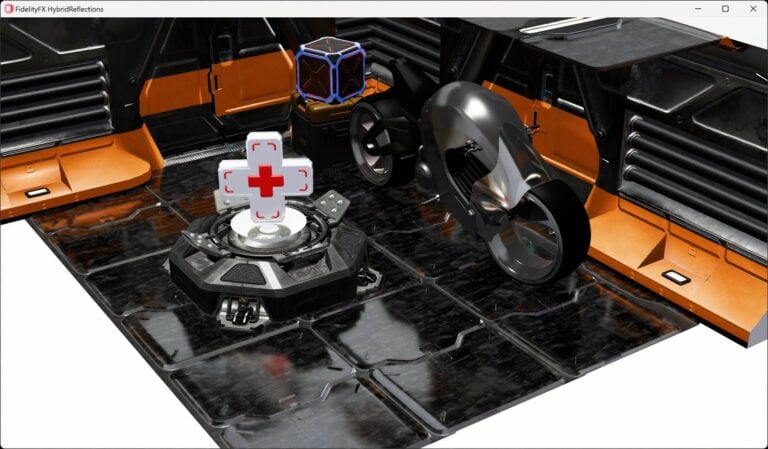
AMD FidelityFX™ Hybrid Stochastic Reflections sample
This sample shows how to combine AMD FidelityFX Stochastic Screen Space Reflections (SSSR) with ray tracing in order to create high quality reflections.
Microsoft® Game Stack Live: Denoising Raytraced Soft Shadows on Xbox Series X|S and Windows with FidelityFX
We explain how FidelityFX Denoiser allows for high-quality raytracing results without increasing rays per pixel, and deep dive into specific AMD RDNA™ 2-based optimizations that benefit both Xbox Series X|S and PC.
AMD RDNA™ 2 – DirectX® Raytracing 1.1 – YouTube link
Graphics feature architect Rys Sommefeldt provides a short presentation on the major advantages of the new API, and how to best utilize it on AMD RDNA™ 2-based hardware.

The RDP provides a communication channel with the Radeon™ Adrenalin driver. It generates event timing data used by the Radeon™ GPU Profiler (RGP), and the memory usage data used by the Radeon™ Memory Visualizer (RMV).
Radeon™ Memory Visualizer (RMV) is a tool to allow you to gain a deep understanding of how your application uses memory for graphics resources.
RGP gives you unprecedented, in-depth access to a GPU. Easily analyze graphics, async compute usage, event timing, pipeline stalls, barriers, bottlenecks, and other performance inefficiencies.
Radeon GPU Analyzer is an offline compiler and performance analysis tool for DirectX®, Vulkan®, SPIR-V™, OpenGL® and OpenCL™.
Our other tools
GPU Reshape is a powerful tool that leverages on-the-fly instrumentation of GPU operations with instruction level validation of potentially undefined behavior.
Radeon™ GPU Detective (RGD) is a tool for post-mortem analysis of GPU crashes. RGD can capture AMD GPU crash dumps from DirectX® 12 apps.
This is a Visual Studio® Code extension for Radeon GPU Analyzer (RGA) to allow you to use RGA directly from within VS Code.
If you want to know how well a game is performing on your machine in real-time with low overhead, OCAT has you covered.
Compressonator is a set of tools to allow artists and developers to more easily work with compressed assets and easily visualize the quality impact of various compression technologies.


