Analyze.
Adjust.
Accelerate.
Now available as part of the Radeon™ Developer Tool Suite.
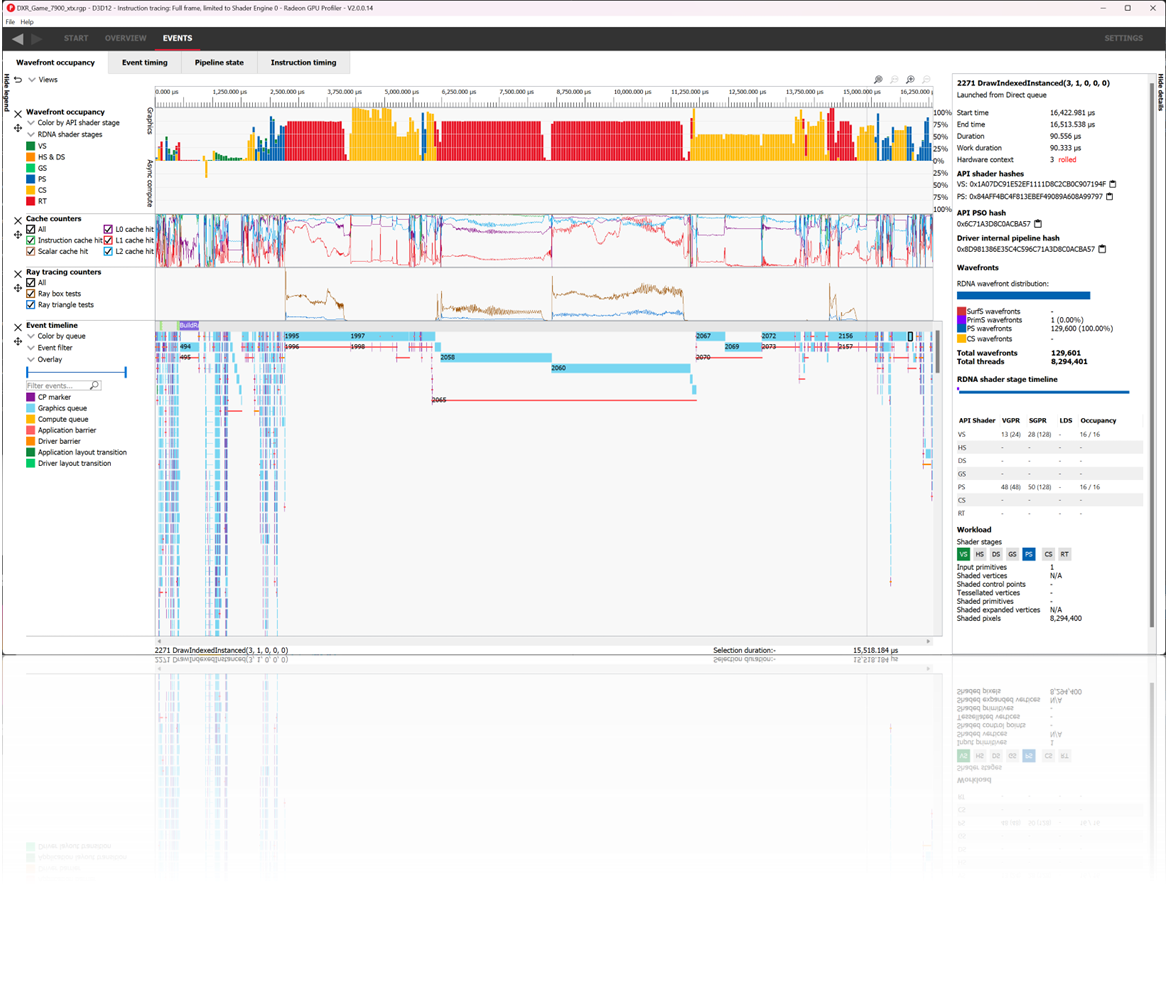
Meet the Radeon™ GPU Profiler, a ground-breaking low-level optimization tool that provides detailed information on Radeon™ GPUs.
Download the latest version - v2.1
This release adds the following
- Interoperability with the Radeon GPU Analyzer: binary pipelines can now be extracted from a loaded profile data set in RGP and automatically loaded into a new instance of RGA for analysis
- Rows in Wavefront occupancy pane can now be resized, allowing for additional user customization
- New “Color by limiting factor” coloring mode in the Wavefront occupancy and Event timing panes. This will highlight events whose theoretical occupancy is limited by VGPR usage, LDS usage or thread group dimensions
- New “Color by context rolls” coloring mode in the Wavefront occupancy and Event timing panes. This will highlight events where a context roll occurred since the previous event
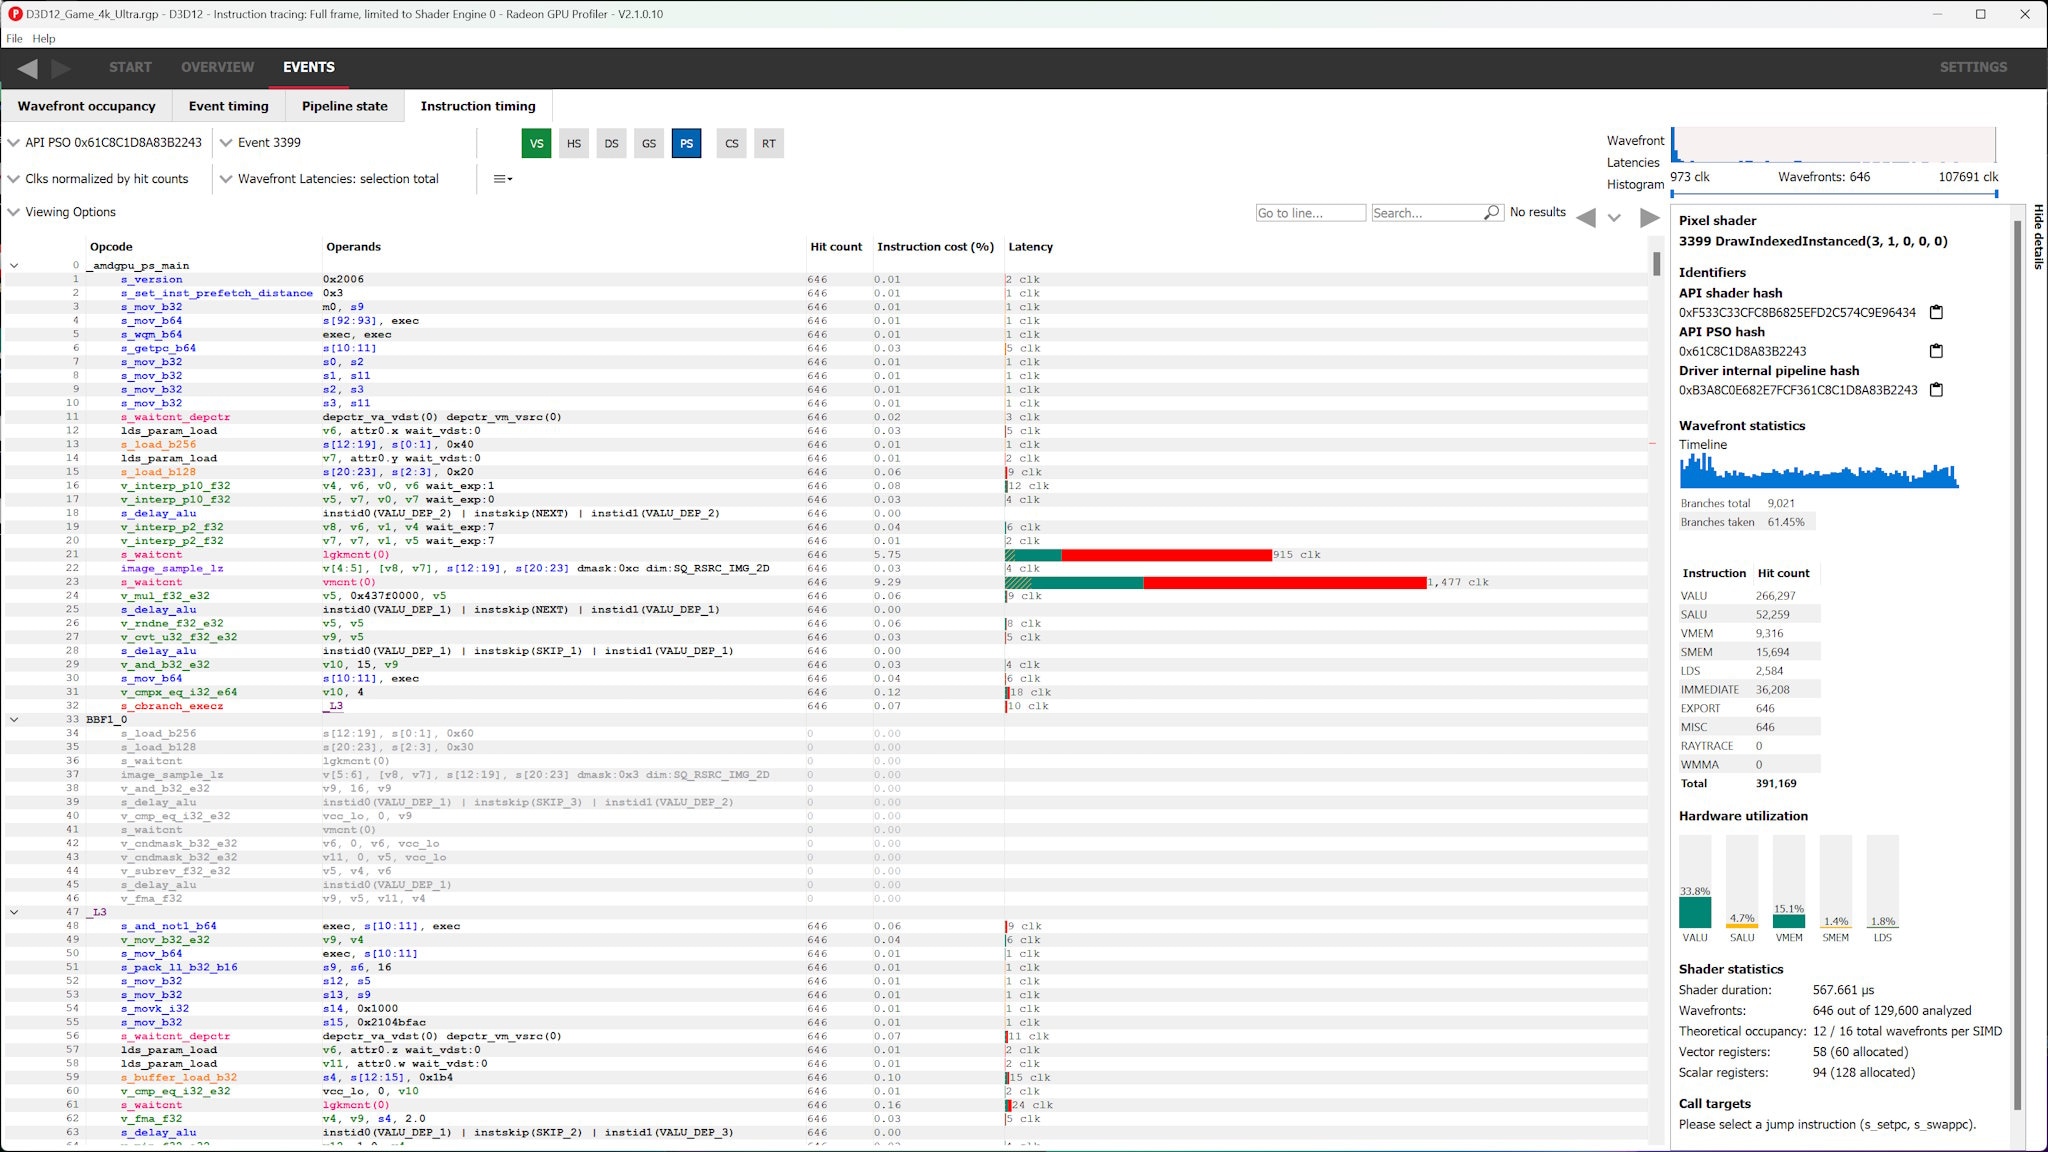
- Latency visualization in the Instruction timing pane will now show which part of the total latency represents a “pre-issue” stall
- Fixed issue with incorrect LDS usage reported on RDNA™-based GPUs
- Many bug/stability/usability fixes
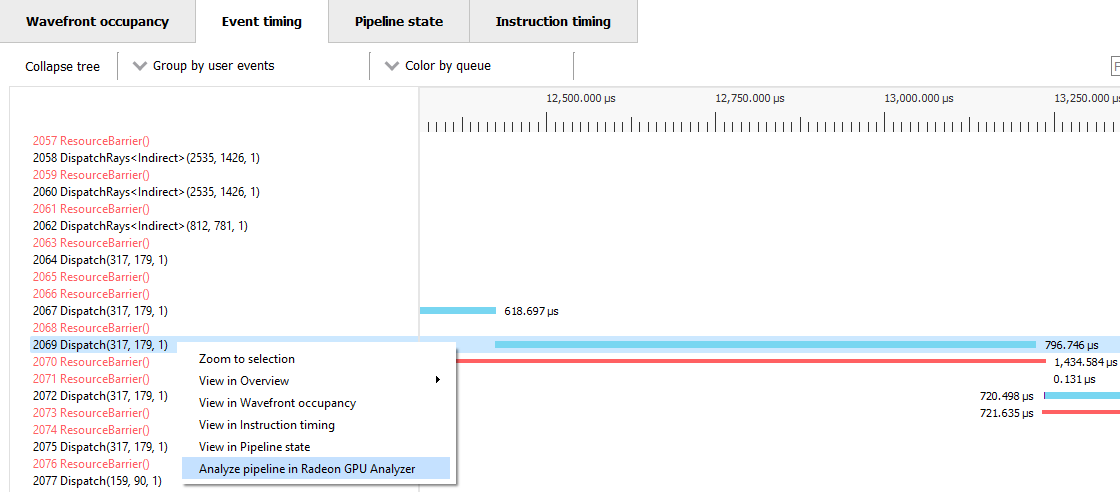
Radeon™ GPU Profiler 2.1 adds interoperability with Radeon™ GPU Analyzer (and more)!
RGP 2.1 adds RGA interoperability, ‘Color by’ modes, and additional customization options. Dive in for all the details!
Benefits
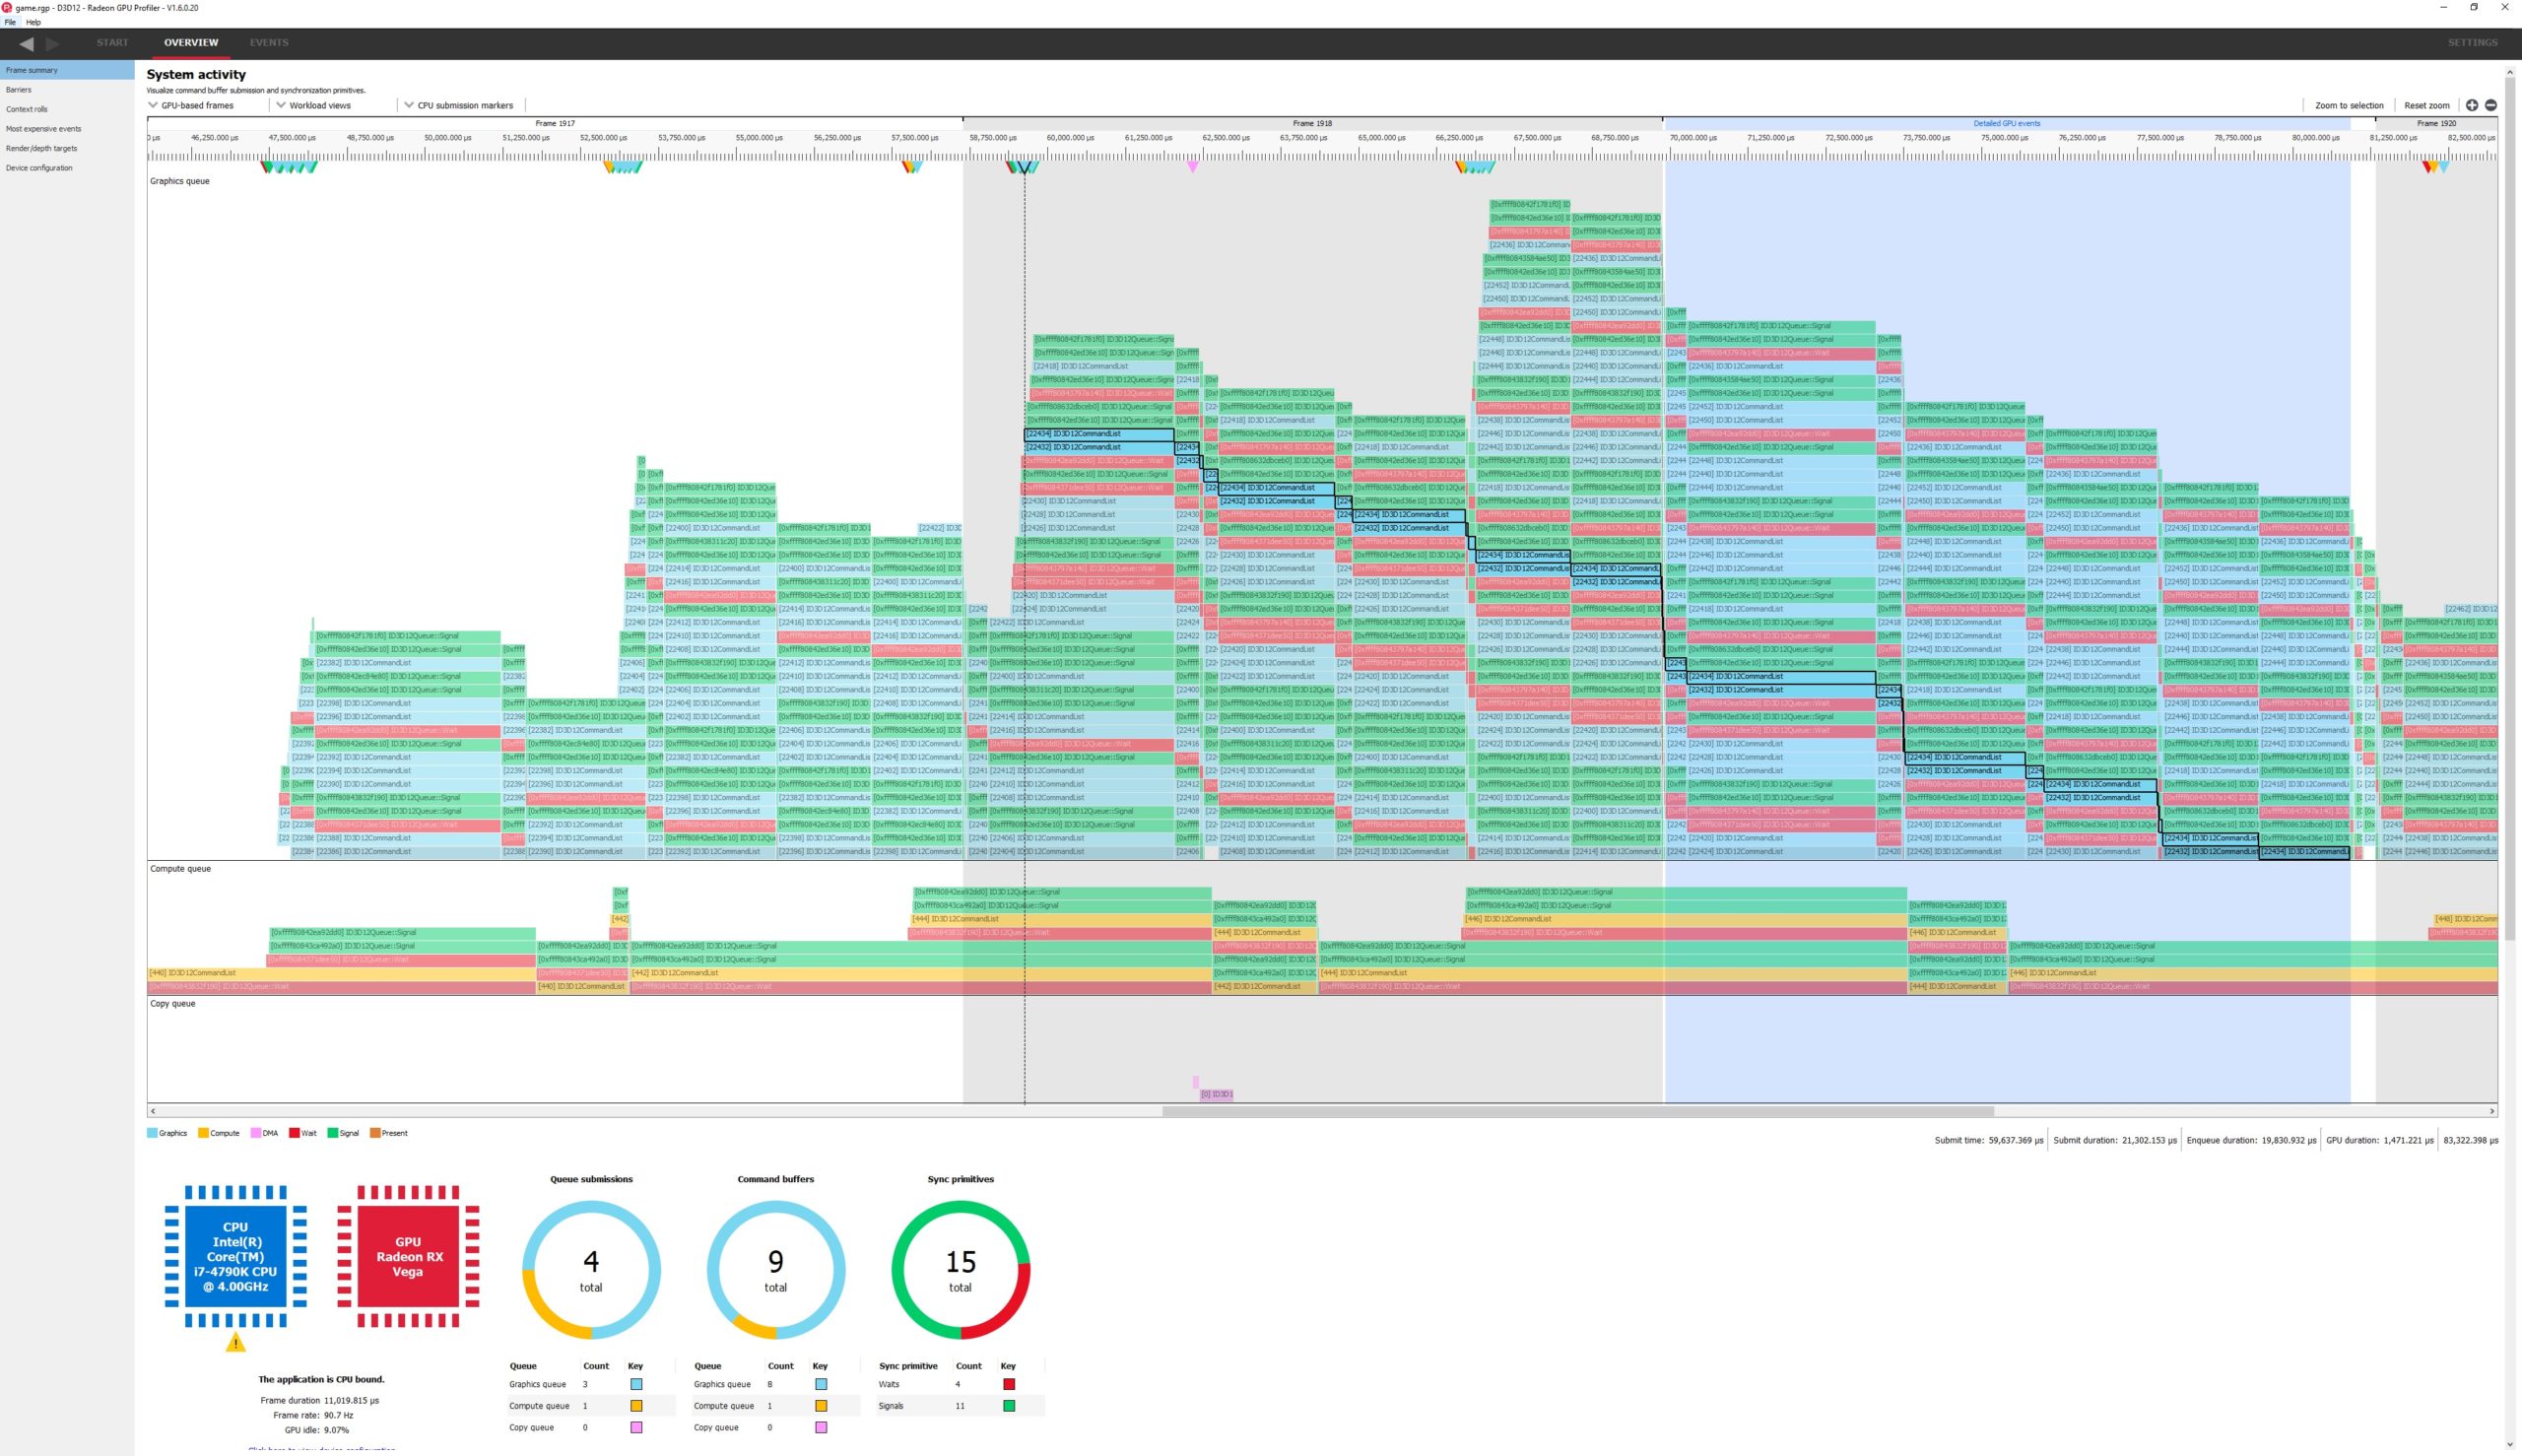
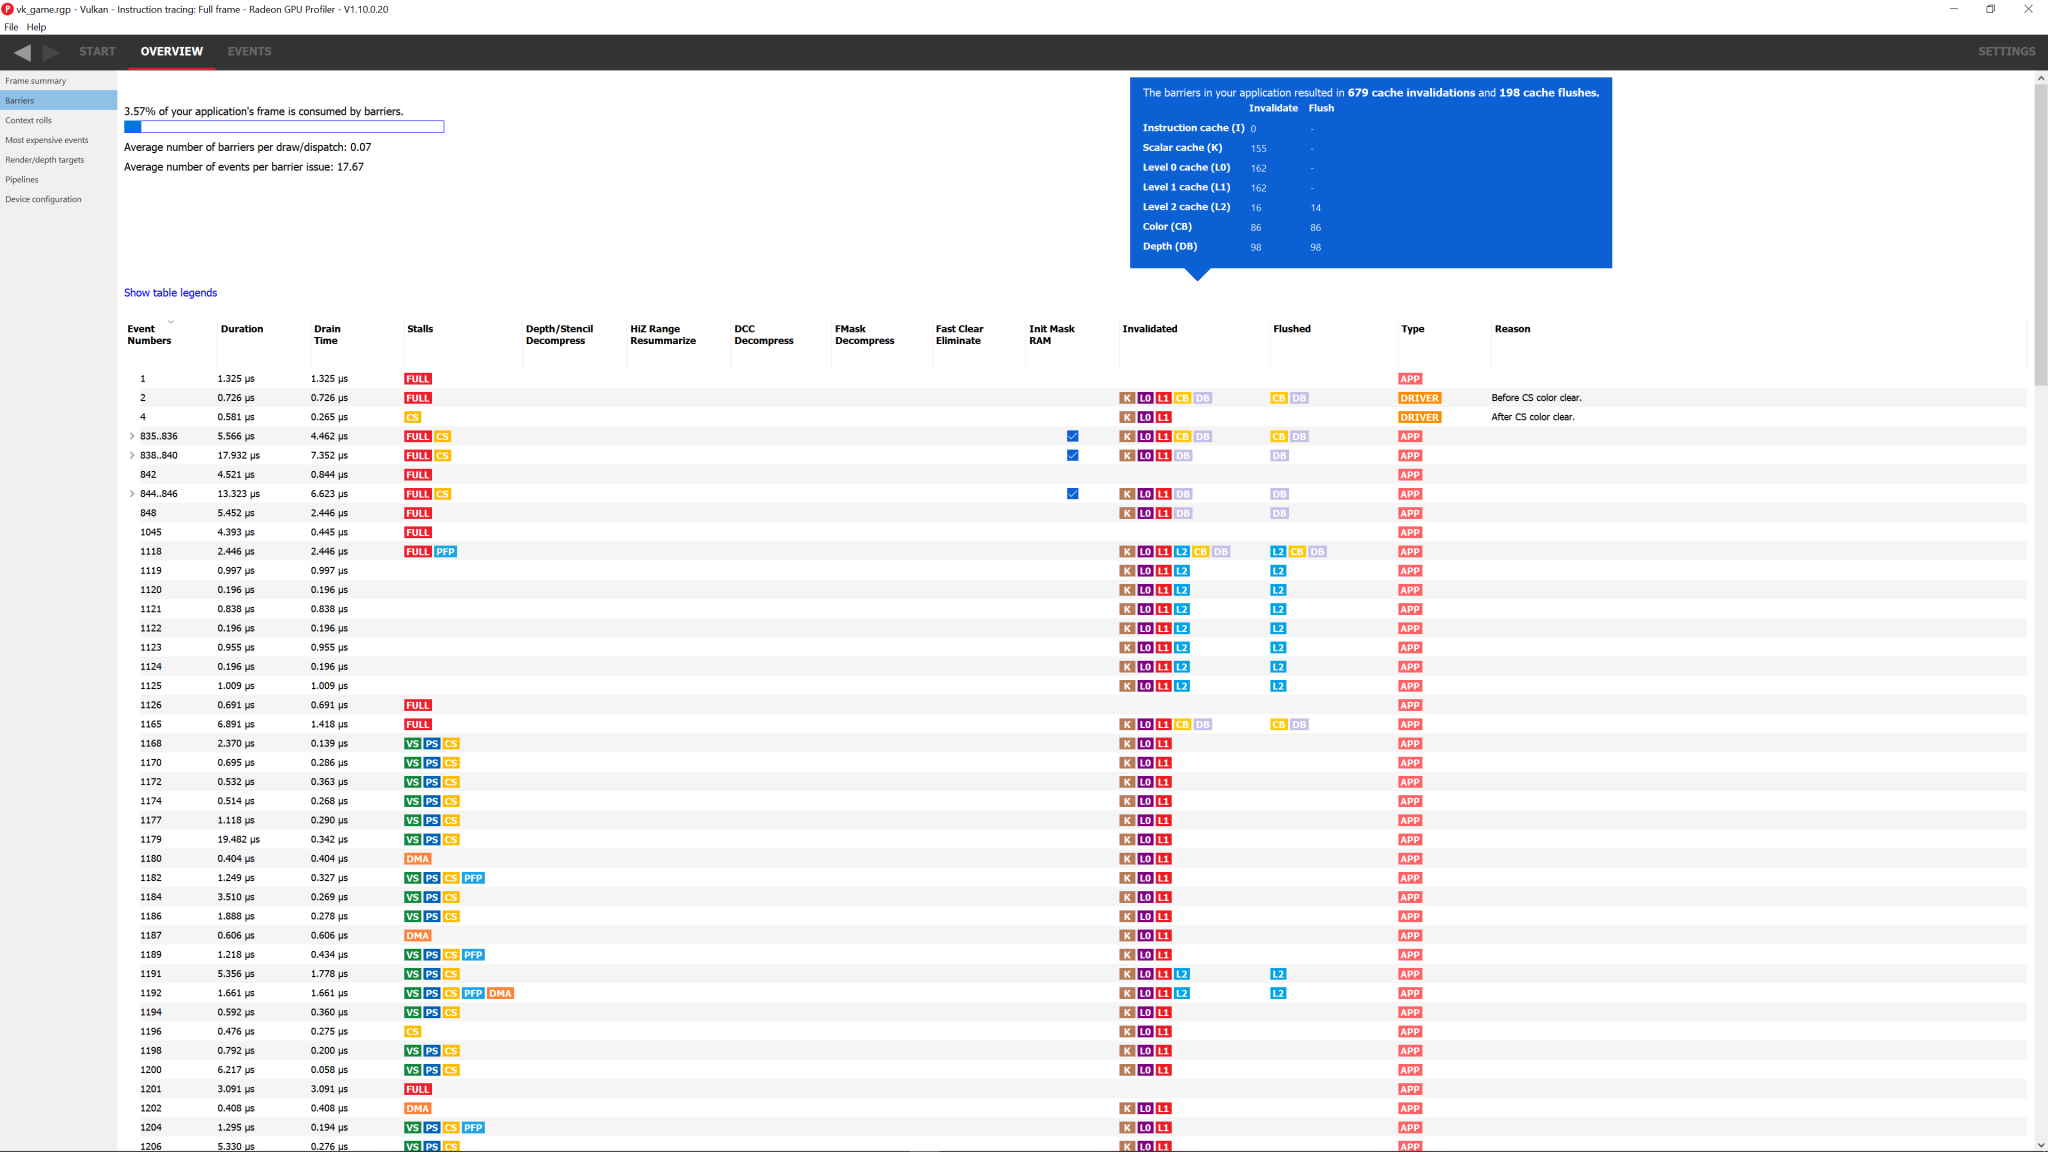
Unlike the black box approach of the past, PC game developers now have unprecedented, in-depth access to a GPU and can easily analyze graphics, async compute usage, event timing, pipeline stalls, barriers, bottlenecks, and other performance inefficiencies.
This unique tool generates easy to understand visualizations of how your DirectX®12, Vulkan®, OpenCL™, and HIP applications interact with the GPU at the hardware level. Profiling a game is both a quick and simple process using the Radeon™ Developer Panel and our public GPU driver.
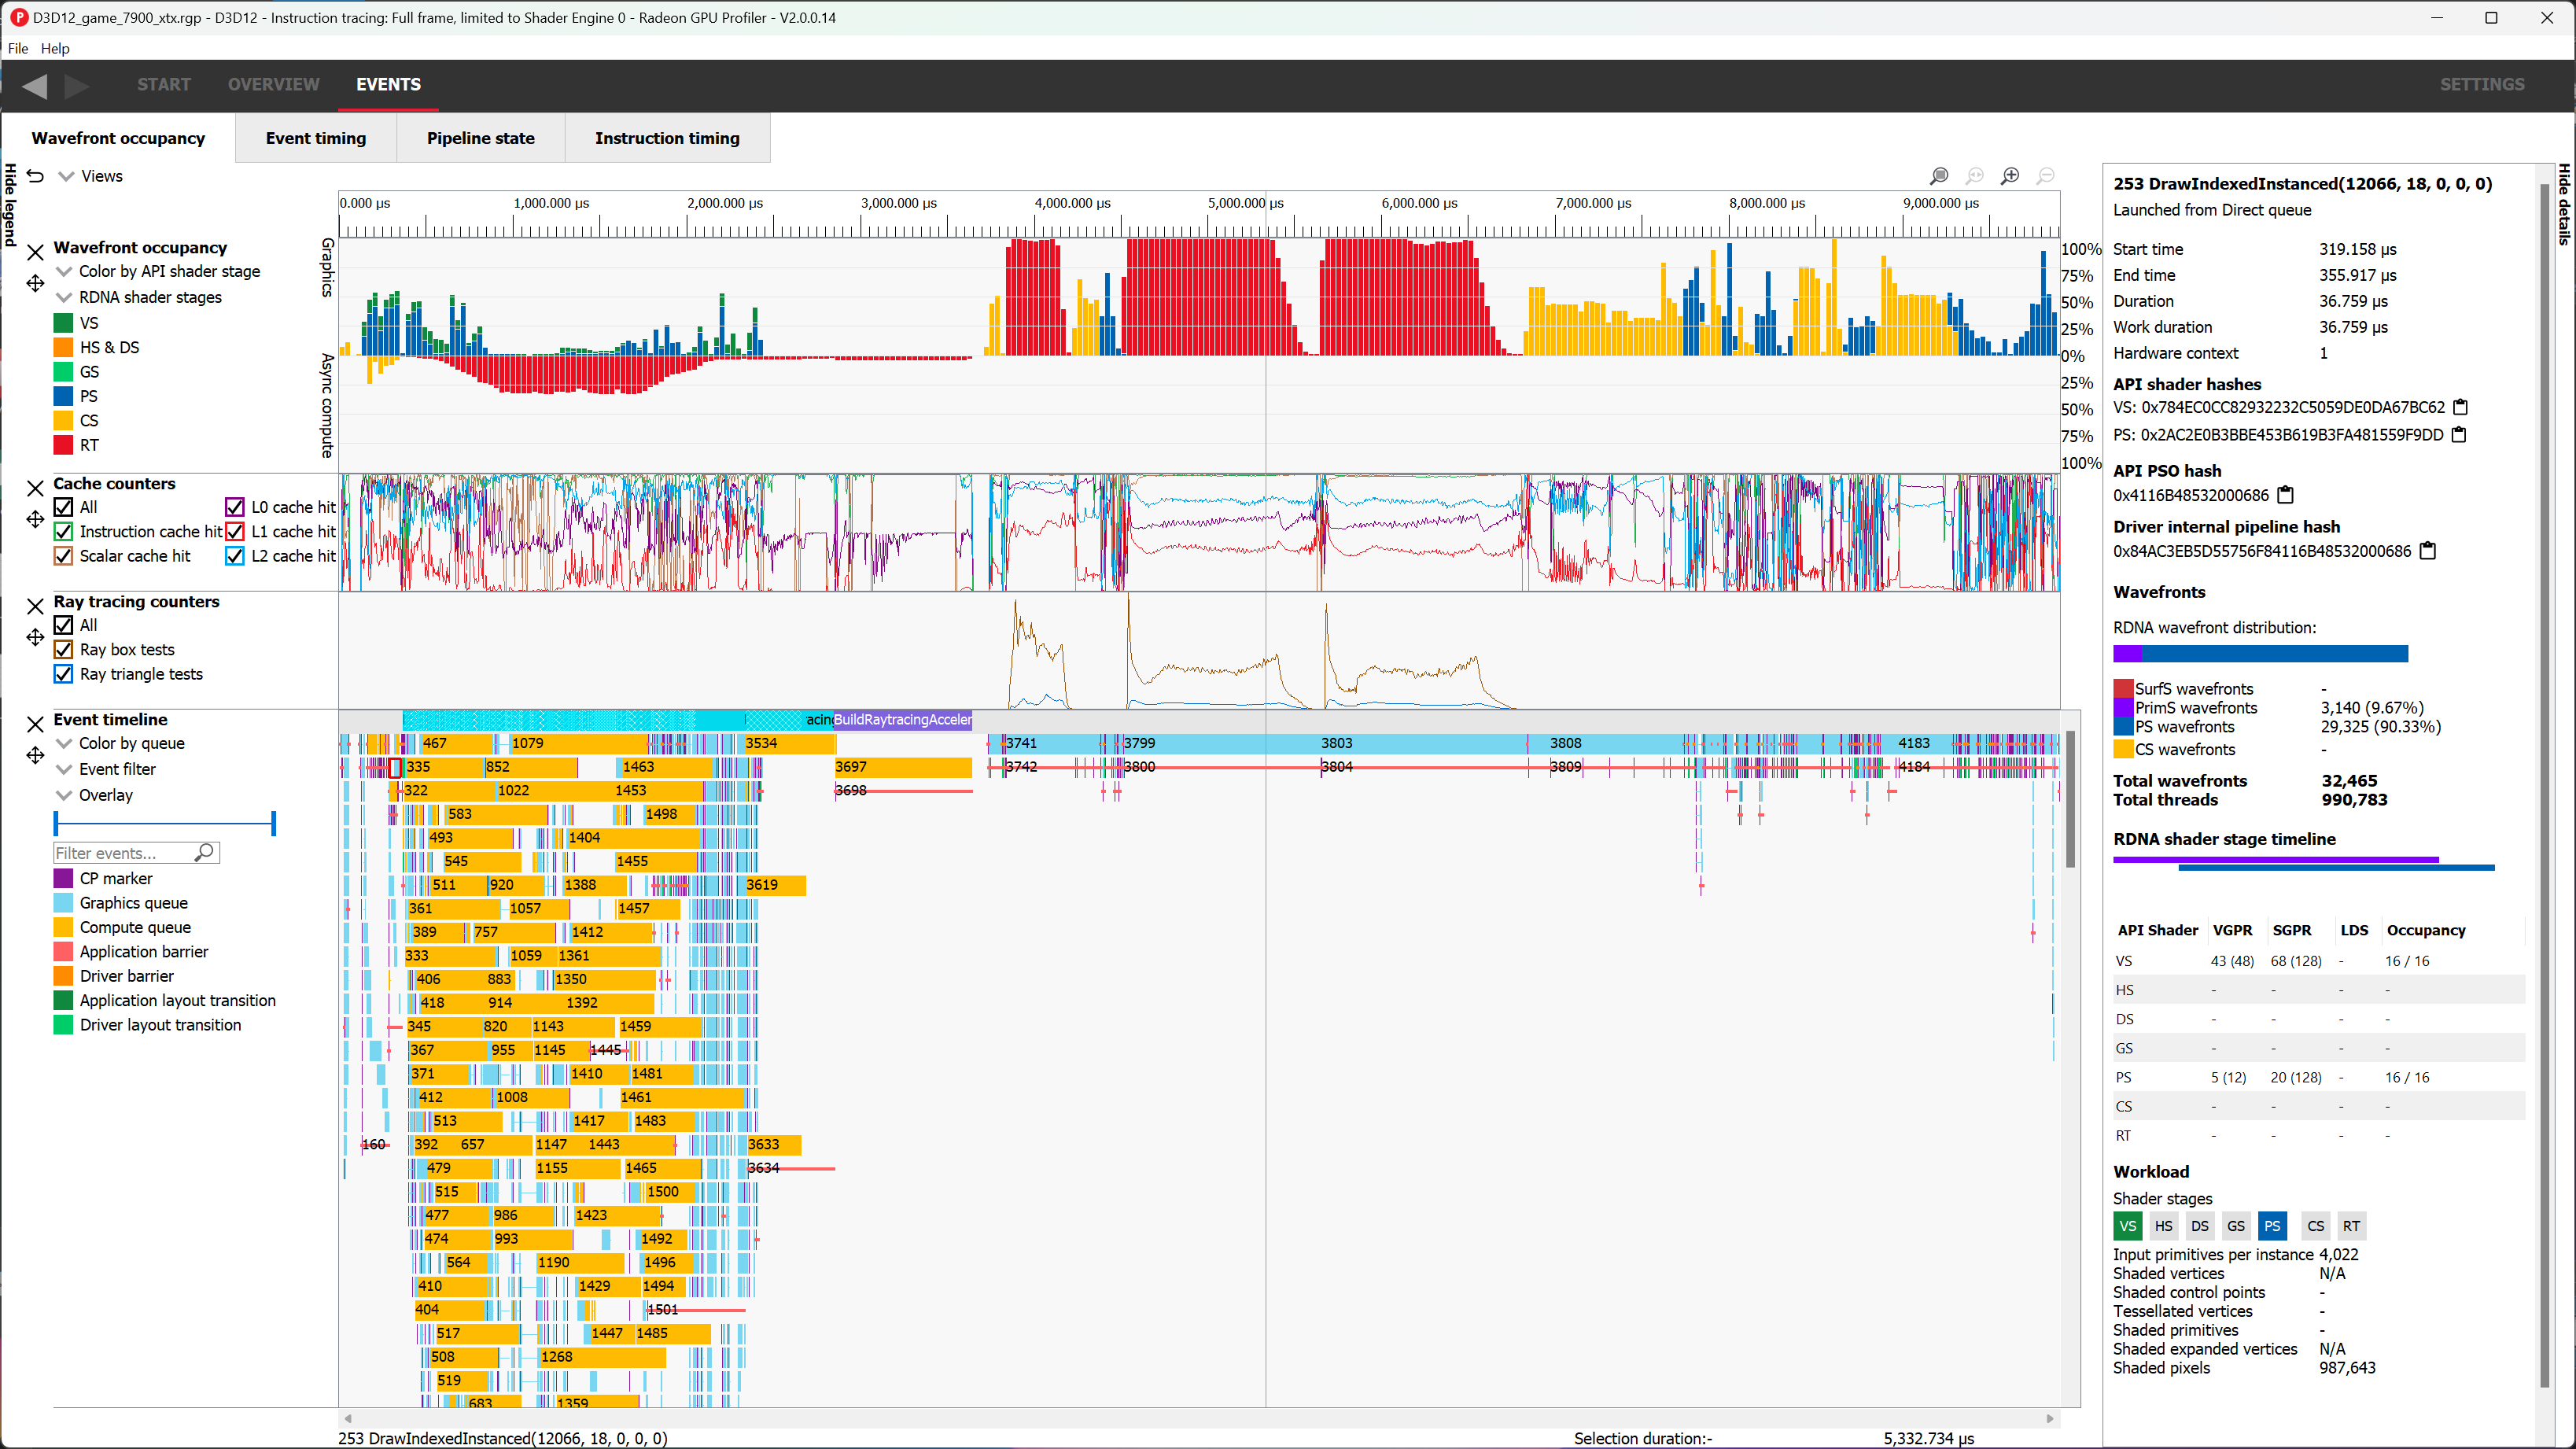
Wade through your wavefronts
Understand how your wavefronts were pushed through the GPU. We can also correlate between wavefronts and the GPU events which launched them, and provide insight into how your frame utilizes the various GPU memory caches.
The data displayed in this view is highly filterable, groupable, and includes a side panel with added detail about user selections.
Requirements
Supported GPUs
- Radeon™ RX 7000 series
- Radeon™ RX 6000 series
- Radeon™ RX 5000 series
- Ryzen™ Processors with Radeon™ Graphics
Supported graphics APIs
- DirectX® 12
- Vulkan®
Supported compute APIs
- OpenCL™
- HIP
Supported OSs
- Windows® 10
- Windows® 11
- Linux – Ubuntu 22.04.1 LTS (Vulkan® only)
Version history
This release adds the following
- Redesigned Wavefront occupancy user interface, allowing for user customization and improved usage of available screen real estate
- Dark mode user interface support, allowing the user to choose between a light and dark theme (or have RGP follow the OS theme setting)
- The ray tracing shader table displayed in the Pipeline state pane can now display data on thread divergence for individual shader functions (DirectX® 12 only for now, requires AMD Software: Adrenalin Edition™ 23.12.1 or newer)
- Allow opening .rgp files which contain a large number of events
- HIP kernels that contain calls to other functions now support the Call Targets table in the Instruction timing pane’s side panel
- PIX3 marker support updated for latest version of WinPixEventRuntime
- Many bug/stability/usability fixes
- The vertical scroll bars in the ISA disassembly view (in Instruction timing and Pipeline state panes) now indicate the location of search matches and instruction latency hotspot
- Added support for showing the ray tracing pipeline in the Pipeline state pane for profiles generated by the RADV driver
- The Output Merger (OM) Pipeline state pane now shows the Stencil reference value as part of the Depth/Stencil state
- The Output Merger (OM) Pipeline state pane now shows the correct value for “Alpha to coverage enable” on recent hardware
- The Details panel for an event will now show the API shader hashes for each shader in the associated pipeline
- Fix an issue with incorrect behavior in the Wavefront Histogram for long-running compute events
- Fix issues when running RGP on some OS/desktops using a Dark theme
- Added instruction timing support for HIP kernels with function calls
- Allow opening .rgp files larger than 2 GB in size
- Many bug/stability/usability fixes
- Newly redesigned ISA disassembly views in the Pipeline state and Instruction timing panes
- Code blocks can now be collapsed/expanded
- Selected token highlighting allows you to quickly see other instances of the selected token (instruction opcodes, registers and constants)
- One-click navigation between branch instructions and their targets, along with tracked navigation history
- Customize the displayed columns
- Improved search result highlighting
- Improved performance in the System activity timeline in the Frame summary pane when opening large profiles
- Instruction timing side panel will now report the total number of WMMA (wave matrix multiply accumulate) instructions executed by a shader when running on RDNA 3 or newer hardware
- Pipeline state pane will now report when conservative rasterization is enabled
- Fixed issues with keyboard selection in the tree view in the Event timing and Pipeline state panes
- DirectX® 12 Mesh shader functions and Vulkan® Mesh shader extension functions now are identified properly in RGP’s event lists
- Fixed incorrect tree hierarchy in the Event timing and Pipeline state pane when events are grouped by user events and event filtering is used
- Support for AMD RDNA 3 hardware (AMD Radeon RX 7000 Series)
- Support for profiling HIP applications on Windows
- Support for Instruction timing capture and visualization for OpenCL™ and HIP applications (requires RDNA-based hardware and at least a 22.10-based driver)
- The kernel ISA can now be displayed in the Pipeline state pane for OpenCL and HIP applications (requires RDNA-based hardware and at least a 22.10-based driver)
- Cache and raytracing counter collection and visualization are now supported on Linux on RDNA 2 (and newer) hardware (requires at least a 22.40-based driver)
- Support for showing the raytracing pipeline and the raytracing shader table for ExecuteIndirect calls that perform raytracing and use the Indirect compilation path
- The various “Color by” combo boxes in the Events panes can now be automatically synchronized (hold down the CTRL key while selecting a Color By mode from one of the combo boxes)
- The Device configuration pane will now show additional cache size information
- Many bug/stability/usability fixes
- Ray tracing counter collection and visualization in the Wavefront Occupancy pane.
- Support for DirectX® Raytracing (DXR) Tier 1.1 style inline raytracing
- Shaders that perform inline raytracing will be marked as such in various parts of RGP
- New “Color by ray tracing” mode in the Wavefront timeline portion of the Wavefront Occupancy pane will highlight waves from traditional ray tracing events as well as waves from shaders that contain inline ray tracing
- The ISA view in the Pipeline state pane now supports searching
- The shader table in the Pipeline state pane for ray tracing events now shows how many shaders are part of the pipeline
- Many bug/stability/usability fixes
- Instruction timing improvements
- Single-wavefront instruction timing mode
- The UI now shows which parts of an instruction’s latency are hidden by work on other slots
- Searching will now find text matches in labels instead of only instructions
- New “Color by API PSO” mode for the wavefront timeline in the Wavefront Occupancy pane
- Many bug/stability/usability fixes
- Cache counter support for OpenCL™ applications (requires a 21.20-based driver).
- Indirect raytracing pipelines will now show a Call targets table in the Instruction timing pane for any
swappc/setpc(call/return) instructions. - The Cache counters tooltip in the Wavefront Occupancy view will now show aggregated data when there is a selected region.
- Performance improvement when loading profiles.
- Updated to use Qt 5.15.2.
- Many bug/stability/usability fixes.
- Vulkan® ray tracing support.
- Cache counter visualization in the Wavefront Occupancy pane.
- Improved performance when viewing ray tracing profiles.
- Improved copy to clipboard support throughout the RGP UI.
- New Work duration column added to event table in Most Expensive Events pane.
- Many bug/stability/usability fixes.
- Radeon™ RX 6000 Series support (RDNA™ 2)
- DirectX® Raytracing support
- Reduced overhead and memory usage when collecting Instruction timing data
- Improved performance when loading and navigating in the Instruction timing pane
- Many bug/stability/usability fixes.
- Completely redesigned Radeon Developer Panel.
- Many instruction timing improvements:
- Full frame instruction timing data collection.
- Improved accuracy of timing and hardware utilization data.
- Improved support for RDNA wave32/wave64 modes.
- Improved UI handling of running at different DPI display settings.
- Support for running on Ubuntu 20.04.
- Many bug/stability/usability fixes.
- Support for Radeon™ RX 5500 and Radeon™ RX 5300 hardware.
- New Pipelines Overview pane to summarize pipeline usage for the profile.
- Pipelines and Pipeline state views will indicate if a shader was compiled using wave32 vs. wave64 on RDNA hardware.
- In the Barriers pane, additional cache levels (L0/L1/L2) are shown for invalidates on RDNA hardware.
- The Most Expensive Events and Render/Depth Targets panes now have sortable table columns.
- The Frame Summary and Profile Summary panes now show the amount of profiling overhead (the amount of video memory and bandwidth consumed by profile data collection)
- Add Overlays in the Wavefront Occupancy Event Timeline view to view User events, Hardware contexts, Command buffers and Render targets.
- Improved Instruction Timing to increase accuracy of timing data.
- Improved zoom control UI in the various panes that support zooming.
- Improved UI when running at different DPI settings.
- Bug/stability fixes.
- Add support for RX5700 and RX5700XT.
- Added instruction timing search.
- Support for displaying profiles taken with instruction tracing data
- Support for displaying user events in the Wavefront Occupancy timeline view
- Support to display GCN ISA disassembly in the Pipeline state view
- Support for showing and colorizing API PSO hash for each event
- New grouping modes based on API PSO hash
- Improved grouping of events and waves
- Additional state bucket to support API PSO hashes
- Barriers pane now has sortable columns in the table
- Version number added to title bar
- A Check For Updates feature has been added to alert users when a new version of the tool is available
- Support to display OpenCL profiles
- Fix “Stall due to context rolls” table entry in the Events table on the Context rolls pane to toggle
time units correctly - Enable search string to search by user marker if selecting “color by user marker” in the Event timing
pane - Display an error dialog box if the profile being loaded exceeds the maximum number of events supported by RGP
- Fix duplicate user event strings being displayed in the events side panel
- Fix bug in the event-to-bucket lookup when grouping by state bucket in the Event timing pane
- Bug/stability fixes & UI clean ups
- Replace the pie charts in the side details pane with a bar graph
- API Shader resource usage table added to the single event side panel, showing
register and LDS usage along with theoretical wavefront occupancy - Addition of a pie chart showing the number of queue submissions on the frame summary pane
- Addition of a render/depth targets overview pane
- Bug/stability fixes & UI clean ups
- Adds interop between RGP and RenderDoc. An RGP profile can be taken from RenderDoc and events can be selected in one tool and displayed in the other. To use the interop features, install the latest driver. This is 18.5.1 or higher for Windows, or 18.10 for Linux. RenderDoc V1.1 now supports the interop feature, available here: https://renderdoc.org/
- Shows presentation indicators in the System Activity section (reliant on latest driver)
- Adds feature to find an event’s parent command buffer (RGP panes –> System Activity)
- Adds feature to find a command buffer’s first child event (System Activity –> RGP panes)
- For driver-inserted barriers, shows the reason why the barrier was inserted. Shown on the barriers pane and in the details pane when an event is selected in one of the Events panes
- Adds support for Ryzen 5 and Ryzen 3 Processors with Radeon Vega Graphics (aka “Raven Ridge”)
- GPU only view option added to system activity view
- Placed system activity checkboxes inside new pulldowns: Workload views and CPU submission markers
- Color by command buffer added to Event Timing and wavefront occupancy timeline views
- Barriers & layout transitions extended to show whether they originated from the application or the driver. Text indicating the reason for the barrier will be shown if available
- Fixed-function work shown as part of an event in the Event timing pane and the timeline in the wavefront occupancy view
- Actionable context rolls, showing the state changes that caused them
- Improved wavefront occupancy resolution settings
- Support for PIX3 user markers
- Updated to use Qt5.9.2
- Bug/stability fixes & UI clean ups
- This is the first public release of the Radeon GPU Profiler
Related to Radeon™ GPU Profiler

Radeon™ GPU Profiler 1.16 is here!
Radeon GPU Profiler v1.16 updates the GPU ISA disassembly view, adds improved dark mode support, and more.
New Work Graphs sample & RGP support for GPU Work Graphs
“D3D12SimpleClassify” shows the use of a GPU Work Graph in a simple frame-based graphics application, plus learn about new RGP support.

Radeon™ GPU Profiler 1.15 provides an enhanced ISA view experience and more
Radeon GPU Profiler v1.15 adds an enhanced user experience for GPU ISA disassembly, mesh shader event names, WMMA support, and more.
RDNA 3: Radeon GPU Profiler 1.14 introduces support for Radeon™ RX 7000 Series, HIP, and more
Radeon GPU Profiler 1.14 is here, with support for Radeon™ RX 7000 series GPUs, profiling HIP applications, and much more. Take a look!
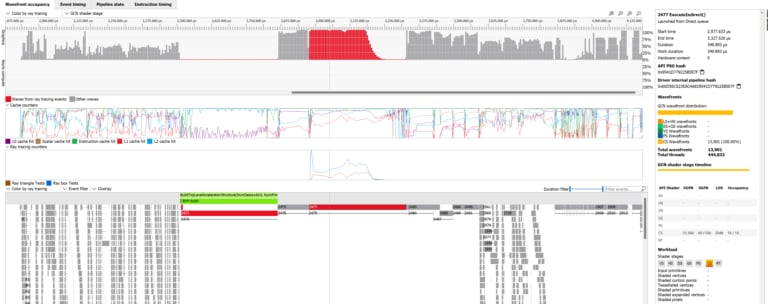
Radeon™ GPU Profiler 1.13 and Radeon Developer Panel 2.6
RGP 1.13 adds enhanced ray tracing features, such as new performance counters and inline RT. RDP 2.6 includes improved data capture.
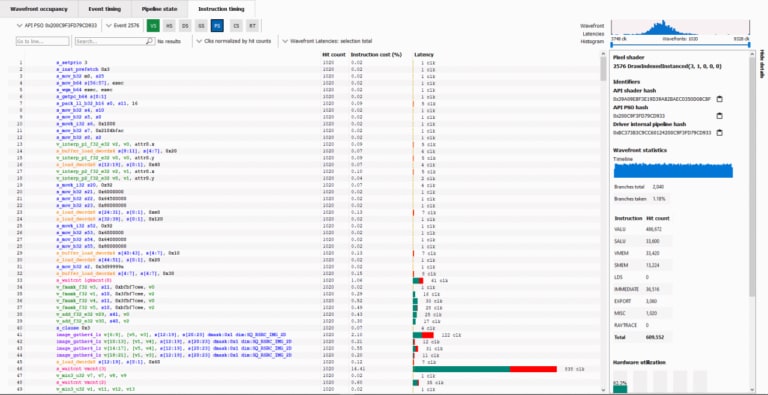
Radeon™ GPU Profiler 1.12 features improvements to Instruction Timing
RGP 1.12 provides some significant enhancements to the Instruction Timing feature, including wavefront filtering and single-wavefront mode.
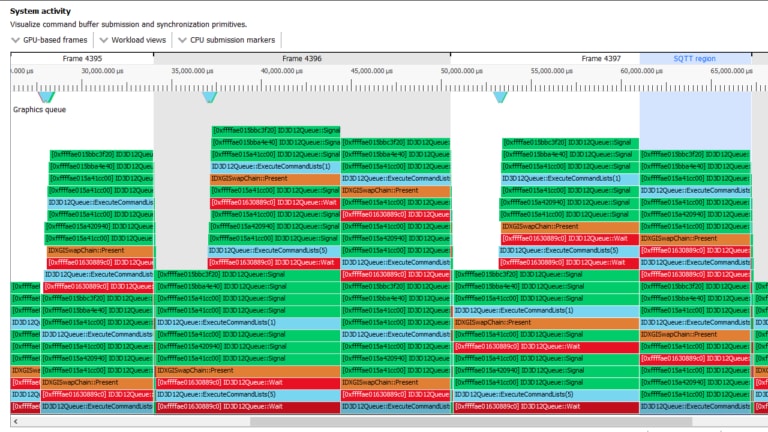
Understanding Graphs in Radeon GPU Profiler and GPUView
Find out how to read and understand graphs in Radeon GPU Profiler and GPUView in order to optimize your game more effectively.
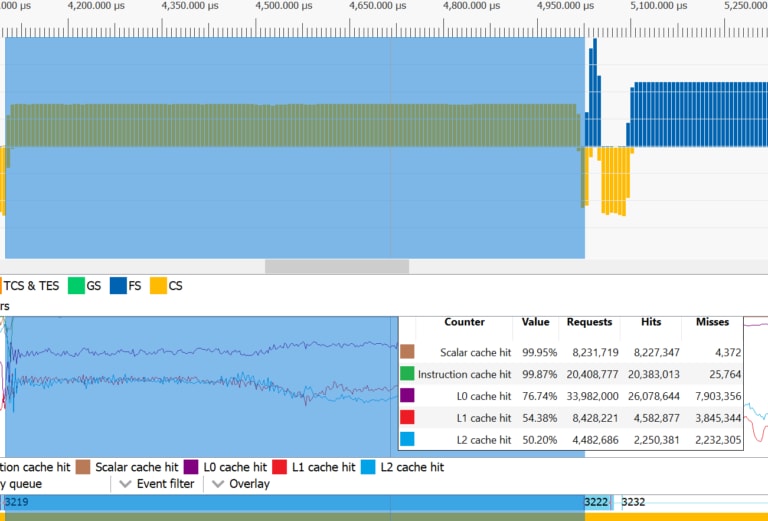
Radeon™ GPU Profiler 1.11 released
RGP 1.11 introduces ray tracing call targets, enhancements to cache counters, and more.
AMD RDNA™ 2 – Radeon™ GPU Profiler 1.10 – YouTube link
RGP 1.9 and 1.10 introduce support for AMD Radeon™ RX6000 series GPUs, a new memory cache counter feature, and support for DirectX® and Vulkan® ray tracing.
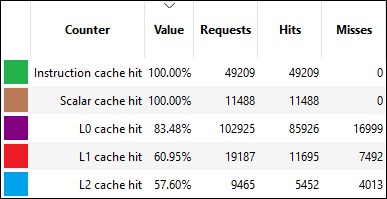
Radeon™ GPU Profiler v1.10 introduces GPU cache counters, Vulkan® ray tracing, and more
This latest release adds support for GPU cache counters, Vulkan® ray tracing, the latest RDNA™ 2 GPUs, and more.

Radeon™ GPU Profiler 1.9 introduces support for Radeon™ RX 6000 Series
The latest release of RGP introduces support for Radeon™ RX 6000 Series (RDNA™ 2) and DirectX® Raytracing, along with several additional new features.
AMD RDNA™ 2 – Radeon™ Developer Tool Suite – YouTube link
This video describes the benefits of bundling the Radeon™ GPU Profiler, Radeon™ Memory Visualizer, Radeon™ GPU Analyzer, and the Radeon™ Developer Panel into a single downloadable suite.

Radeon™ Raytracing Analyzer (RRA) is a tool which allows you to investigate the performance of your raytracing applications and highlight potential bottlenecks.
The RDP provides a communication channel with the Radeon™ Adrenalin driver. It generates event timing data used by the Radeon™ GPU Profiler (RGP), and the memory usage data used by the Radeon™ Memory Visualizer (RMV).
Radeon™ Memory Visualizer (RMV) is a tool to allow you to gain a deep understanding of how your application uses memory for graphics resources.
Radeon GPU Analyzer is an offline compiler and performance analysis tool for DirectX®, Vulkan®, SPIR-V™, OpenGL® and OpenCL™.
Our other tools
GPU Reshape is a powerful tool that leverages on-the-fly instrumentation of GPU operations with instruction level validation of potentially undefined behavior.
Radeon™ GPU Detective (RGD) is a tool for post-mortem analysis of GPU crashes. RGD can capture AMD GPU crash dumps from DirectX® 12 apps.
This is a Visual Studio® Code extension for Radeon GPU Analyzer (RGA) to allow you to use RGA directly from within VS Code.

If you want to know how well a game is performing on your machine in real-time with low overhead, OCAT has you covered.
Compressonator is a set of tools to allow artists and developers to more easily work with compressed assets and easily visualize the quality impact of various compression technologies.


