
Analyze.
Adjust.
Accelerate.
Now available as part of the Radeon™ Developer Tool Suite.
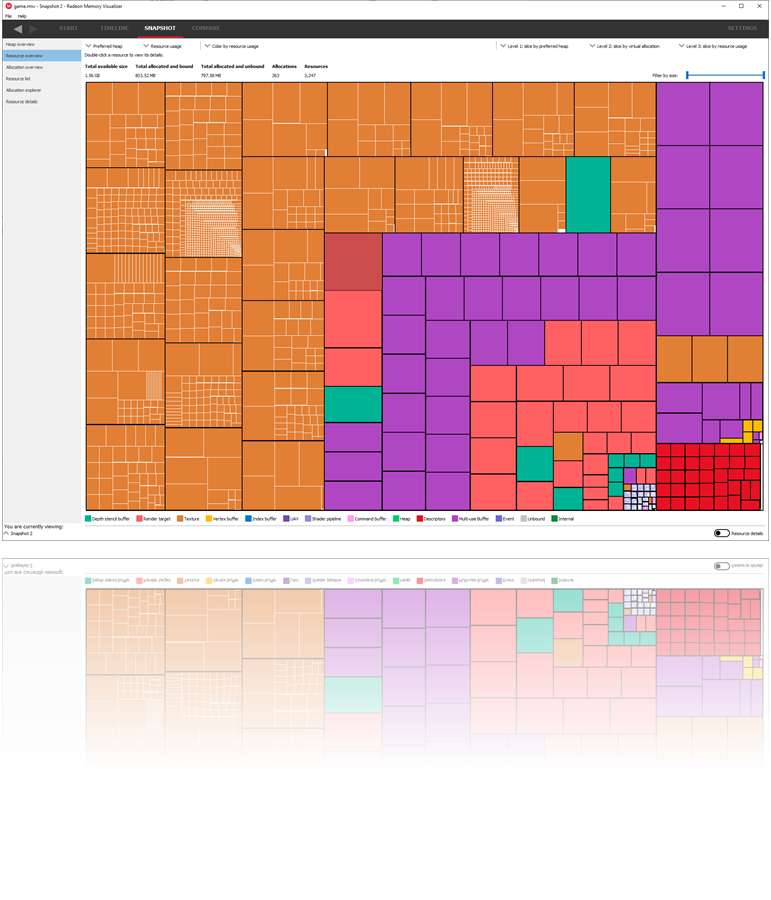
Radeon™ Memory Visualizer (RMV) is a tool to allow you to gain a deep understanding of how your application uses memory for graphics resources.
Download the latest version - v1.9
This release adds the following features:
- Improved resource list sorting.
- Implicit resource detection for heap resources.
- Improved “Filter by size” sliders shown with min and max values.
- Named virtual allocations.
- The default timeline has been changed to “Virtual memory heap” and the “Committed memory” timeline view has been removed.
- Other improvements and bug
Radeon™ Memory Visualizer 1.8 is out now
Radeon™ Memory Visualizer 1.8 is available now. v1.8 enhances the Resource usage size timeline to better visualize overlapped aliased resources.
Benefits
- Profile your game's memory allocations.
- Find memory leaks.
- Understand resource paging.
By instrumenting every level of our Radeon™ driver stack, RMV is able to understand the full state of your application’s memory allocation at any point during your application’s life.
Obliterate oversubscription
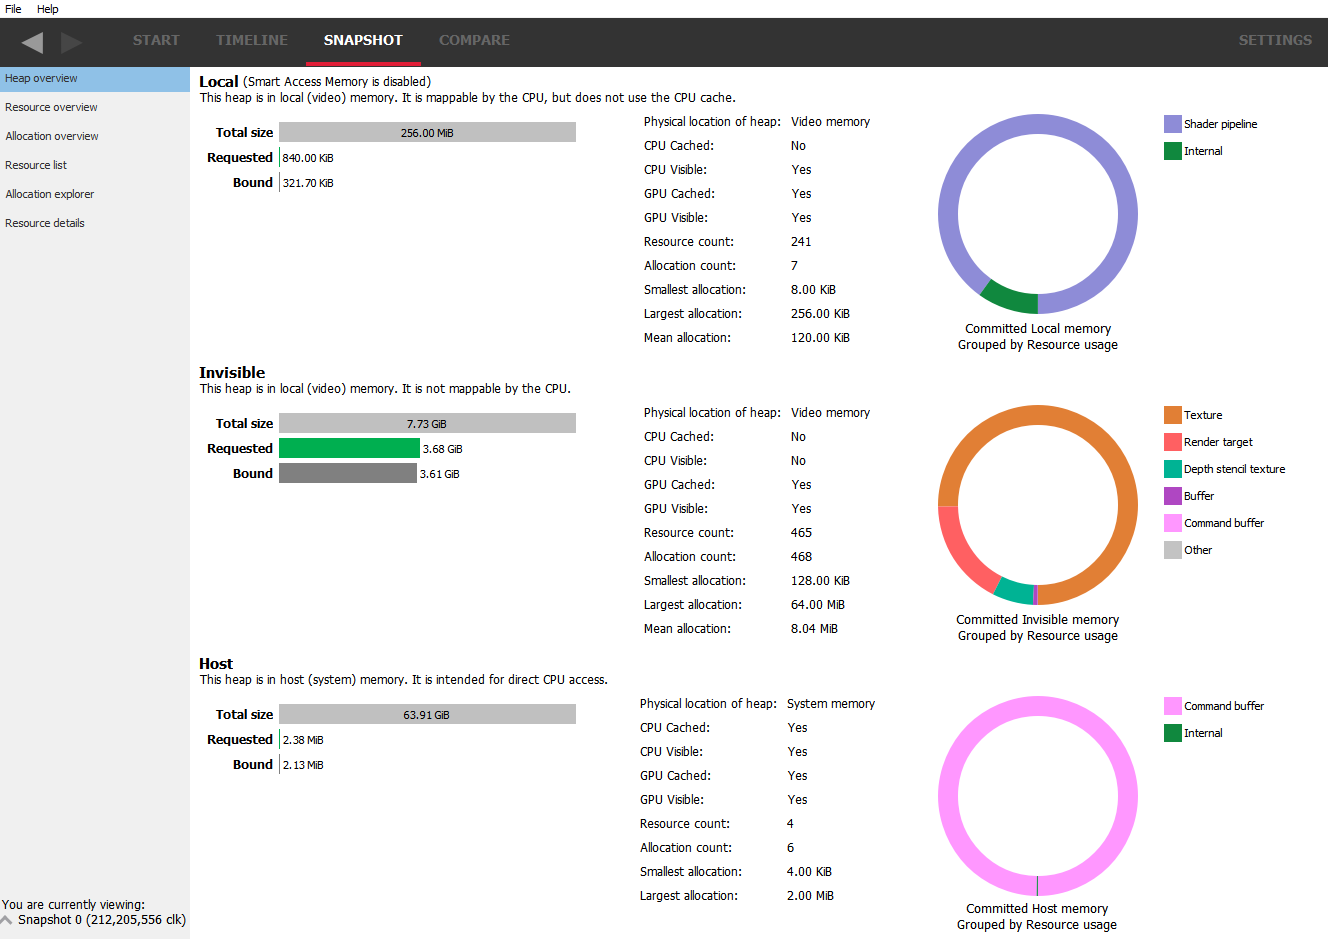
The quick, simple interface tells you if you are over-subscribing a heap, and how the driver stack has reacted. Quickly find resources which are not in the optimal heaps.
Rethink your resources
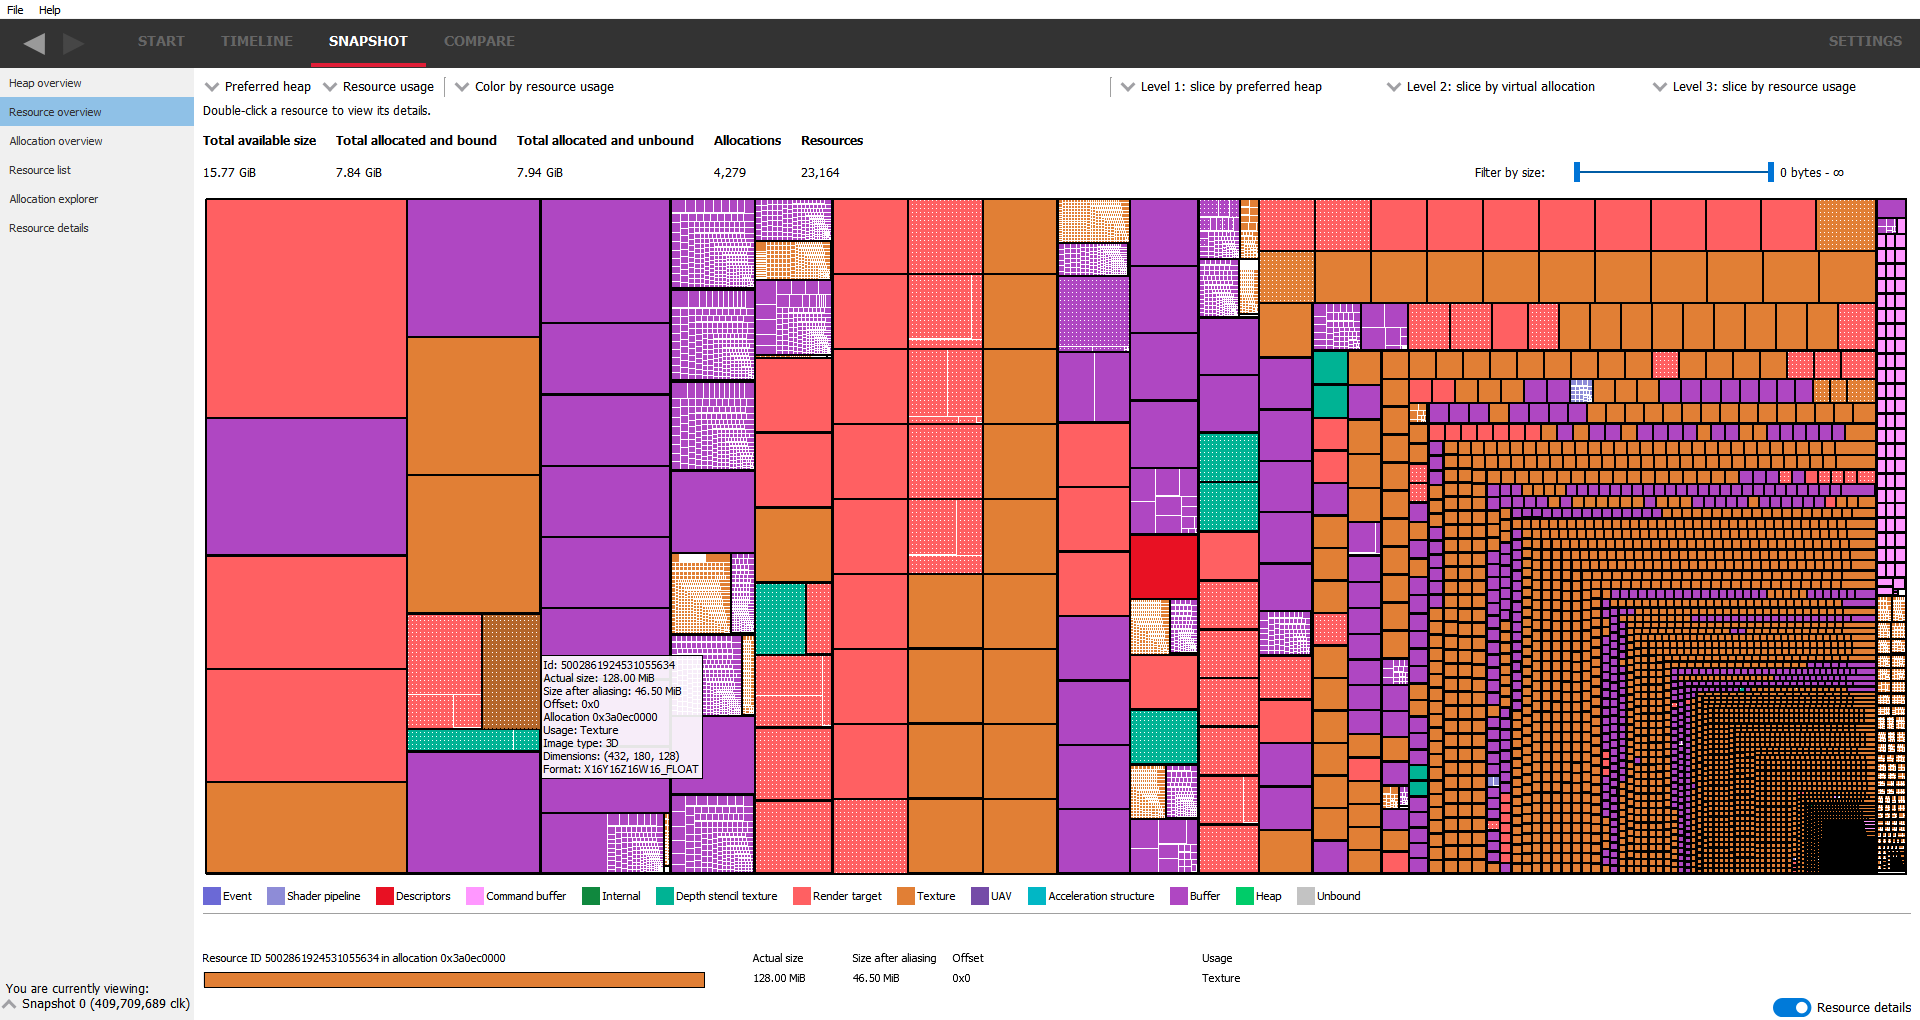
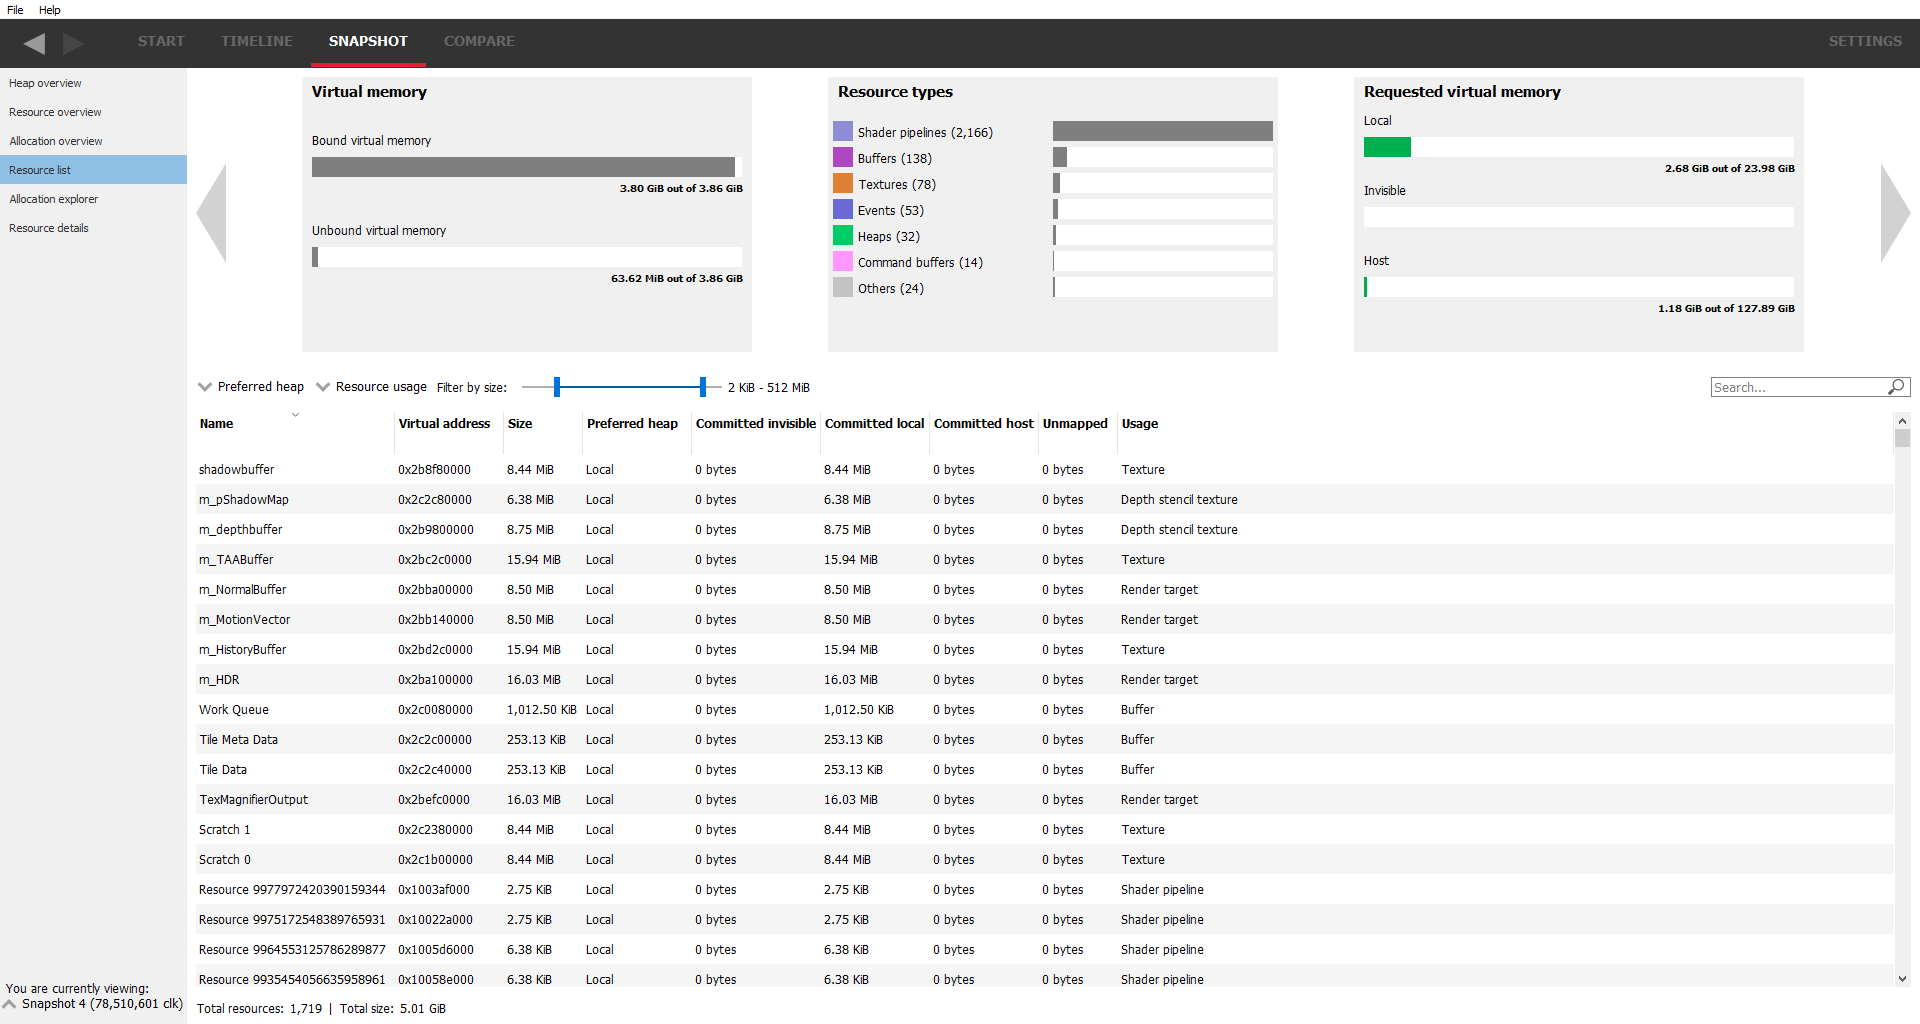
Understand which resources require the most memory, which heaps they are in, and how your heaps are sub-allocated. Rapidly detect patterns in how your application is behaving.
Track your resources by name
Use the DirectX® 12 or Vulkan® API to customize the names of your resources then search and view the details in the Resource list.
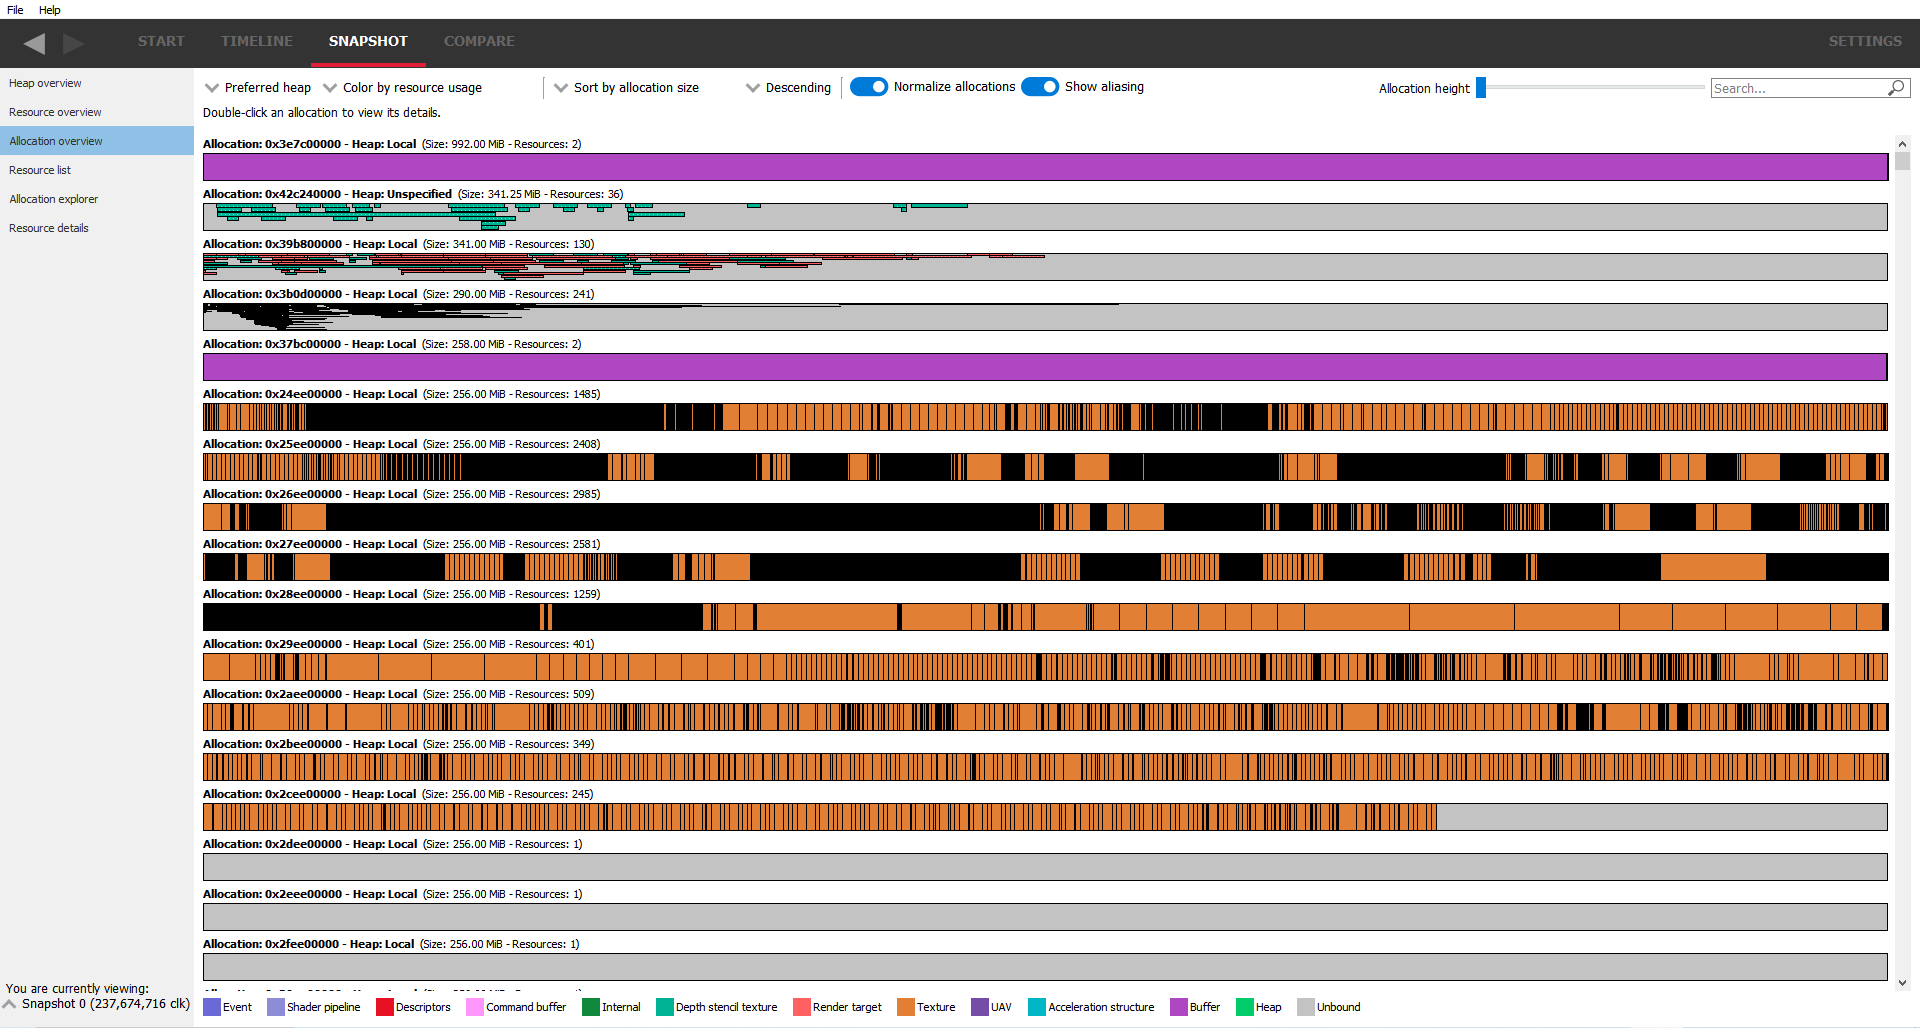
Appreciate your allocations
Look for fragmentation, and understand how you are managing memory in each heap you create. Understand the balance between dedicated and placed resources.
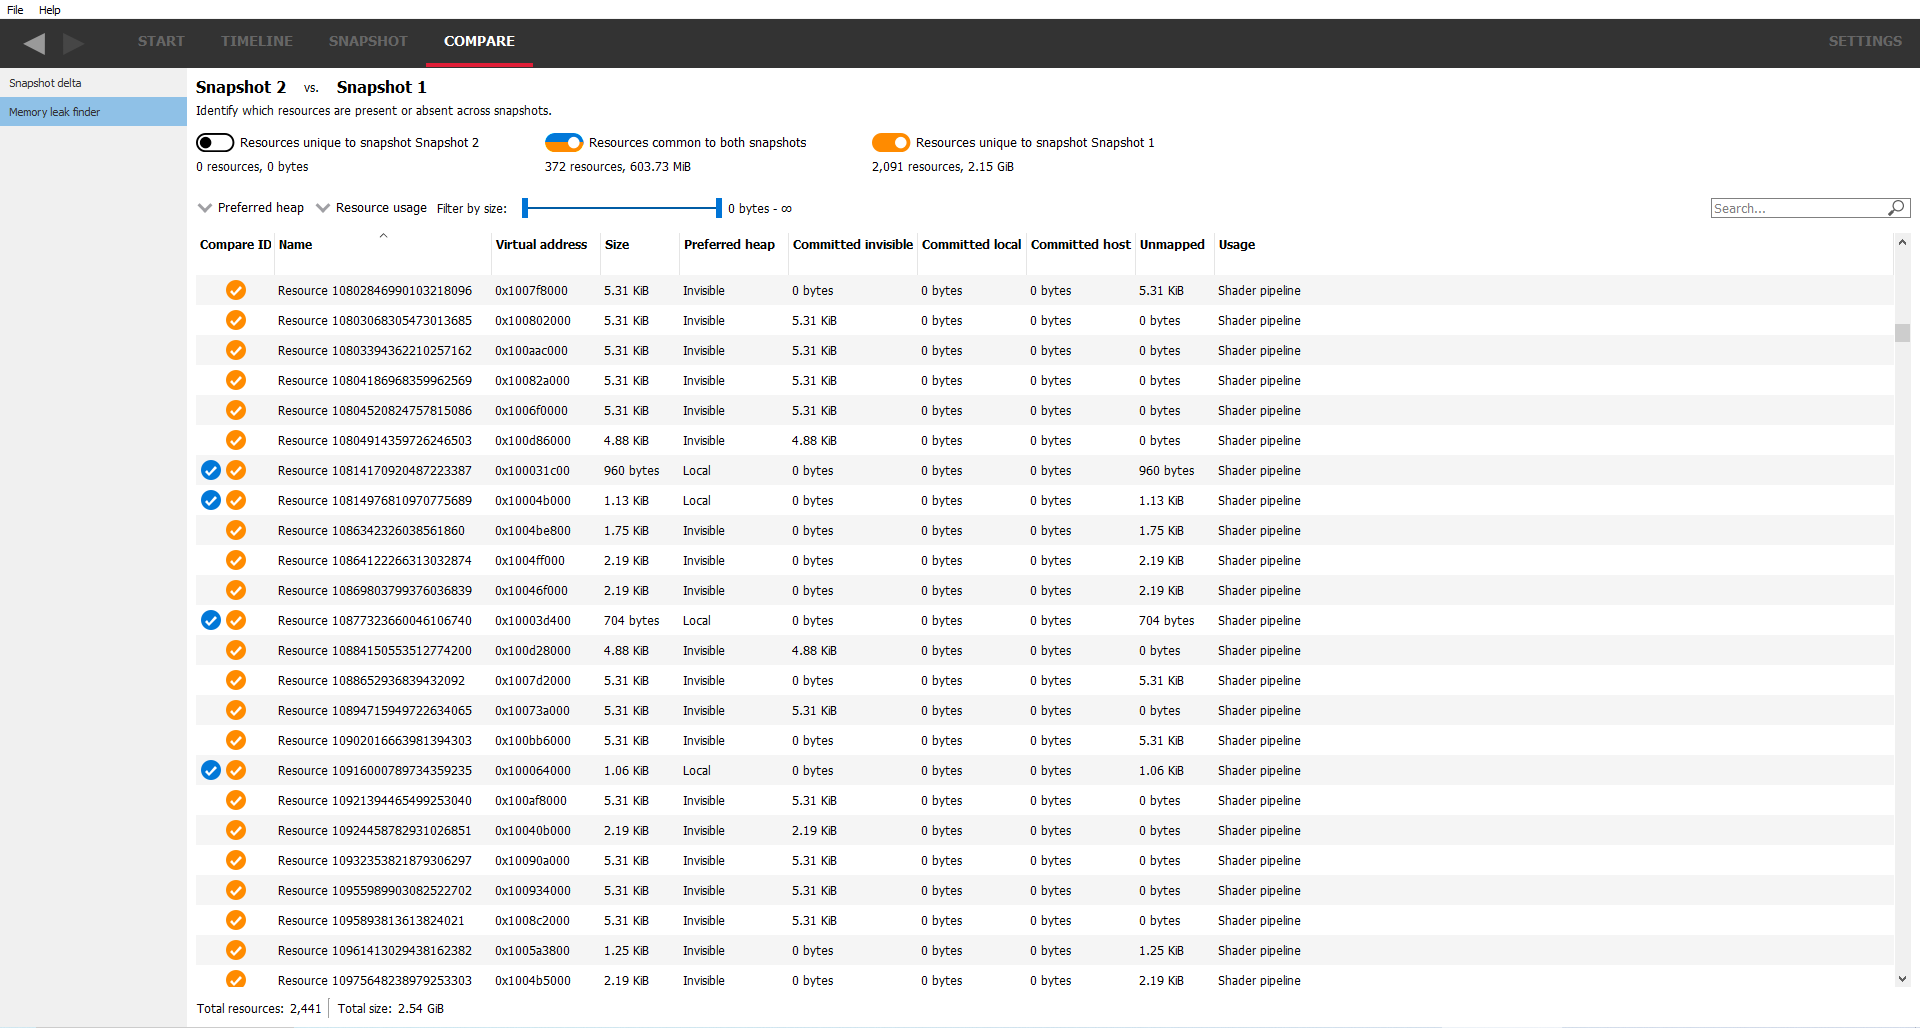
Make good those memory leaks!
Easily find memory leaks in your application by comparing snapshots.
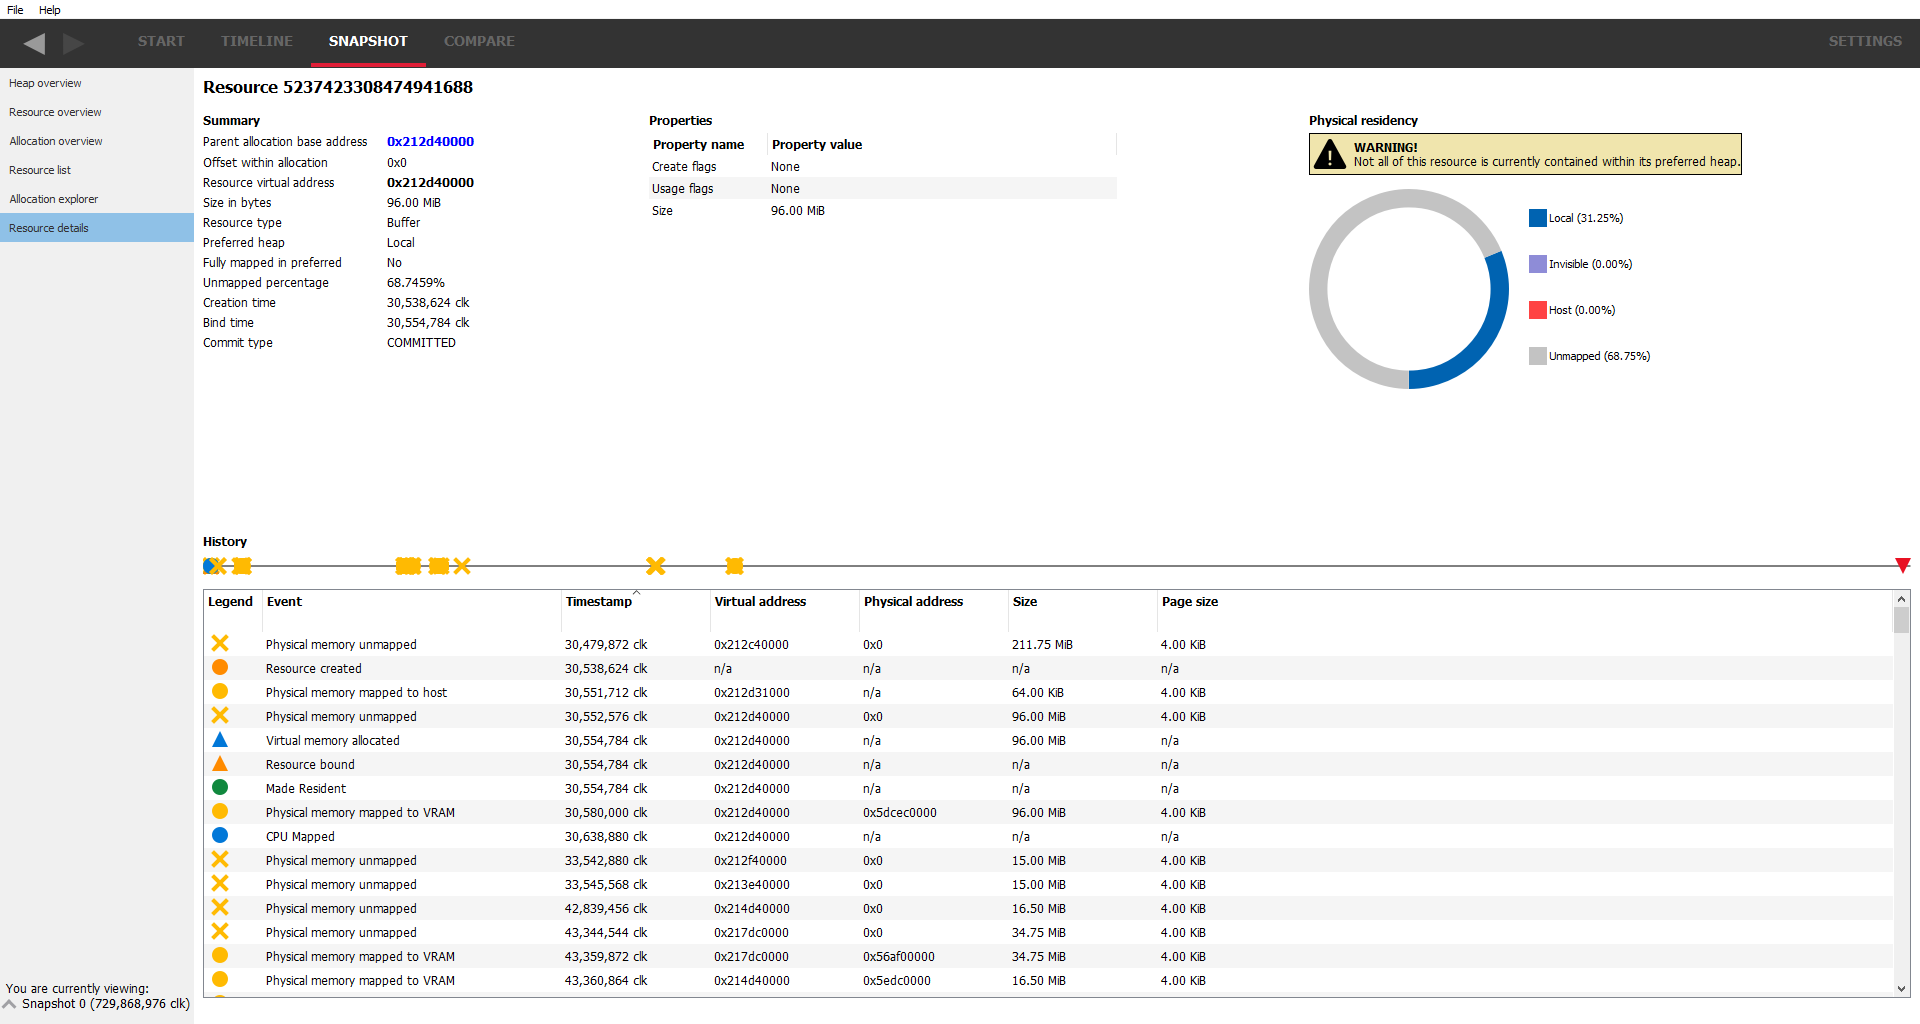
Profile that paging
Dig into how resources have been treated over their lifetime. Understand how the operating system and driver have managed the physical backing for your resources, including paging during times of heap over subscription.
Learn how to get started with Radeon™ Memory Visualizer
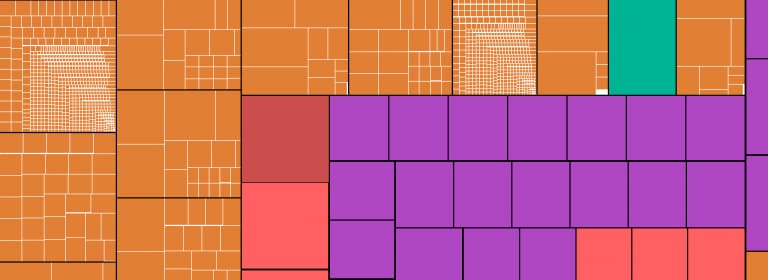
Getting Started with Radeon™ Memory Visualizer (RMV)
Radeon™ Memory Visualizer (RMV) is a tool provided by AMD for use by game engine developers. It allows engineers to examine, diagnose, and understand the GPU memory management within their projects.
Find out more about RMV
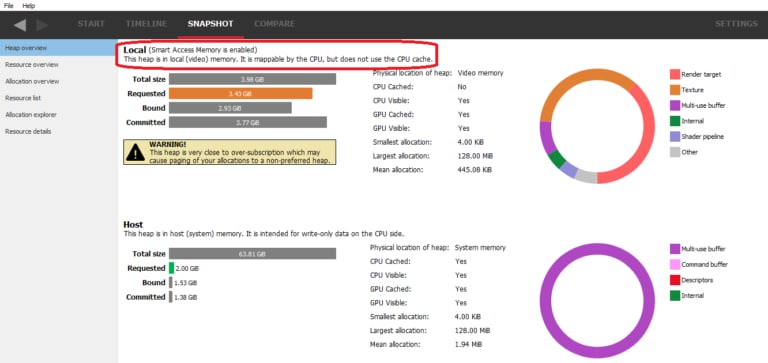
Radeon™ Memory Visualizer 1.4 introduces Smart Access Memory support
Find out in this blog post how you can make all memory visible to the CPU in Radeon Memory Visualizer (RMV) v1.4 with Smart Access Memory.
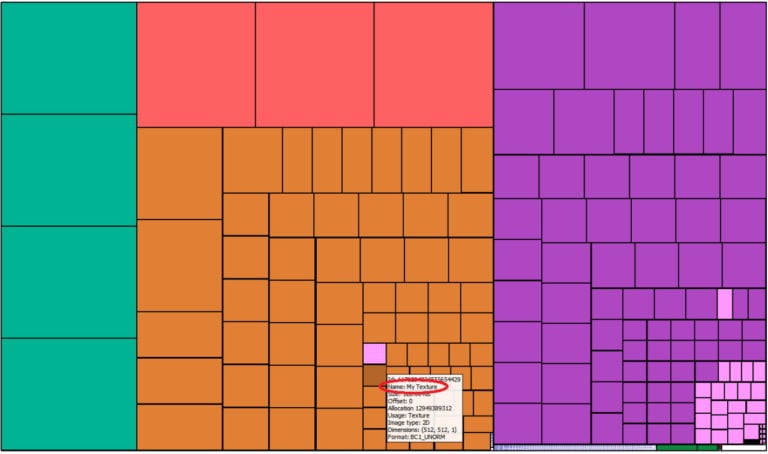
Viewing DirectX® 12 Named Resources with Radeon™ Memory Visualizer 1.3
Radeon Memory Visualizer (RMV) now supports Named Resources in DirectX® 12 applications. This blog explains how you can view them in RMV.
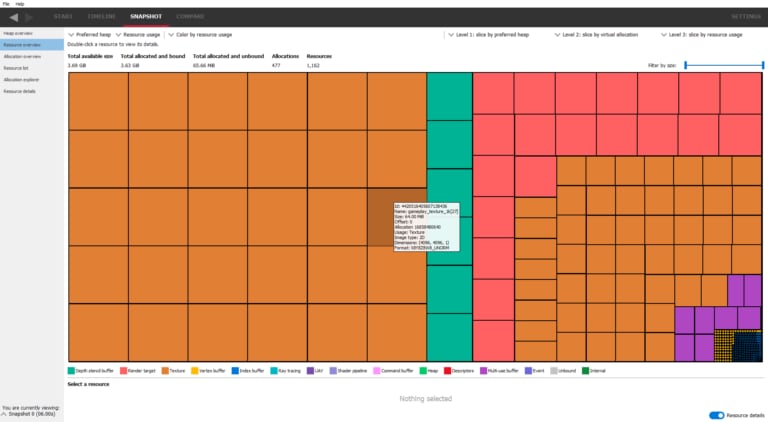
Radeon™ Memory Visualizer (RMV) v1.2 is now available
RMV v1.2 introduces range-based address searching, resource tooltip, and has been updated to work with Qt 5.15.2.

Radeon™ Memory Visualizer is now Open Source
We’re delighted to announce that our Radeon™ Memory Visualizer (RMV) tool is now available as open source under the MIT license.
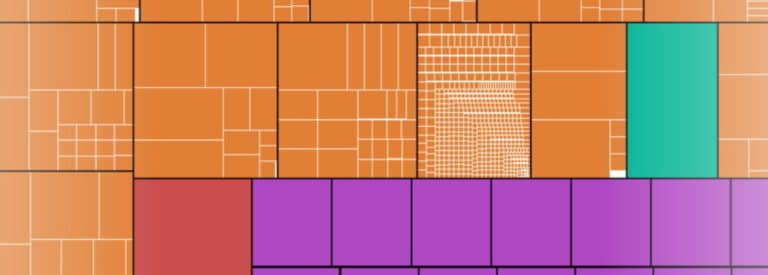
Radeon™ Memory Visualizer v1.1 adds support for aliased resources and more
Radeon Memory Visualizer V1.1 introduces support for aliased resources, and allows selection of a resource in the memory leak finder pane.
AMD RDNA™ 2 – Radeon™ Developer Tool Suite – YouTube link
This video describes the benefits of bundling the Radeon™ GPU Profiler, Radeon™ Memory Visualizer, Radeon™ GPU Analyzer, and the Radeon™ Developer Panel into a single downloadable suite.
AMD RDNA™ 2 – Radeon™ Memory Visualizer 1.1 – YouTube link
This video describes the changes and improvements made to the Radeon™ Memory Visualizer update 1.1.
Curing Amnesia and Other GPU Maladies With AMD Developer Tools – YouTube link
This video introduces the new Radeon™ Memory Visualizer to help answer questions about memory allocations, resource bindings, page mappings, and more. Includes updates on RGP and RGA.
Unified Radeon™ GPU Profiler and Radeon™ Memory Visualizer usage with Radeon™ Developer Panel 2.1
This tutorial explains how to take advantage of the functionality in RDP v2.1 onwards, which unifies the RMV and RGP functionality from earlier versions to provide a unified workflow.
Requirements
Supported GPUs
- Radeon™ RX 7000 series
- Radeon™ RX 6000 series
- Radeon™ RX 5000 series
- Ryzen™ Processors with Radeon™ Graphics
Supported graphics APIs
- DirectX® 12
- Vulkan®
Supported OSs
- Windows® 10
- Windows® 11
- Linux – Ubuntu 22.04 LTS (Vulkan® only)
Version history
- The Resource usage size timeline calculations take resource aliasing into account.
- Unbound memory sizes are included on the Resource usage size timeline.
- Bug/stability fixes.
- Aliased Resource size calculation improvements on Resource overview pane.
- Support for loading Radeon GPU Detective crash dump files.
- Resource naming and implicit buffer filtering made more reliable in DX12.
- Support for hours added (formatted as “H:MM:SS.clk_cycles” and included with the CTRL+T time-cycling shortcut keys).
- System memory type added to device configuration pane (e.g. DDR4).
- Bug/stability fixes.
- Additional parameters added to the resource history table in the resource details pane.
- Improved Device configuration reporting with newer trace files, including CPU and driver information.
- Bug/stability fixes.
- Keyboard shortcuts added for all panes on the Welcome and Settings lists. Some keys have also been remapped to avoid conflict with the Adrenaline software.
- Bug fixes.
- Linux capture support (requires driver version 22.10 or higher).
- Fix for intermittent crash when adding and removing snapshots.
- Support added for traces taken from systems with LPDDR4/5 & DDR5 memory.
- Support for traces taken with Smart Access Memory (SAM) enabled.
- Bugs/stability fixes.
- DirectX® 12 Resource Naming.
- Bug and stability fixes.
- Tooltips added to show resource details on the Resource overview pane.
- Range-based address searching added for the resource tables.
- Bug and stability fixes.
- Source code now available under MIT license.
- Support for showing aliased resources in the allocation overview and allocation explorer panes.
- Reworking of the resource “Filter by size” slider throughout so that the resources are more evenly distributed.
- Empty tables show a graphical indication and description as to why the table is empty.
- “Color by commit type” coloring mode.
- Search box and filter by allocation size to the allocation table in the allocation explorer pane.
- Show unmapped resource memory in residency donut in the resource details pane.
- Initial release

The RDP provides a communication channel with the Radeon™ Adrenalin driver. It generates event timing data used by the Radeon™ GPU Profiler (RGP), and the memory usage data used by the Radeon™ Memory Visualizer (RMV).
Radeon™ Memory Visualizer (RMV) is a tool to allow you to gain a deep understanding of how your application uses memory for graphics resources.
RGP gives you unprecedented, in-depth access to a GPU. Easily analyze graphics, async compute usage, event timing, pipeline stalls, barriers, bottlenecks, and other performance inefficiencies.
Radeon GPU Analyzer is an offline compiler and performance analysis tool for DirectX®, Vulkan®, SPIR-V™, OpenGL® and OpenCL™.
Our other tools
GPU Reshape is a powerful tool that leverages on-the-fly instrumentation of GPU operations with instruction level validation of potentially undefined behavior.
Radeon™ GPU Detective (RGD) is a tool for post-mortem analysis of GPU crashes. RGD can capture AMD GPU crash dumps from DirectX® 12 apps.
Radeon™ Raytracing Analyzer (RRA) is a tool which allows you to investigate the performance of your raytracing applications and highlight potential bottlenecks.
This is a Visual Studio® Code extension for Radeon GPU Analyzer (RGA) to allow you to use RGA directly from within VS Code.

If you want to know how well a game is performing on your machine in real-time with low overhead, OCAT has you covered.
Compressonator is a set of tools to allow artists and developers to more easily work with compressed assets and easily visualize the quality impact of various compression technologies.


